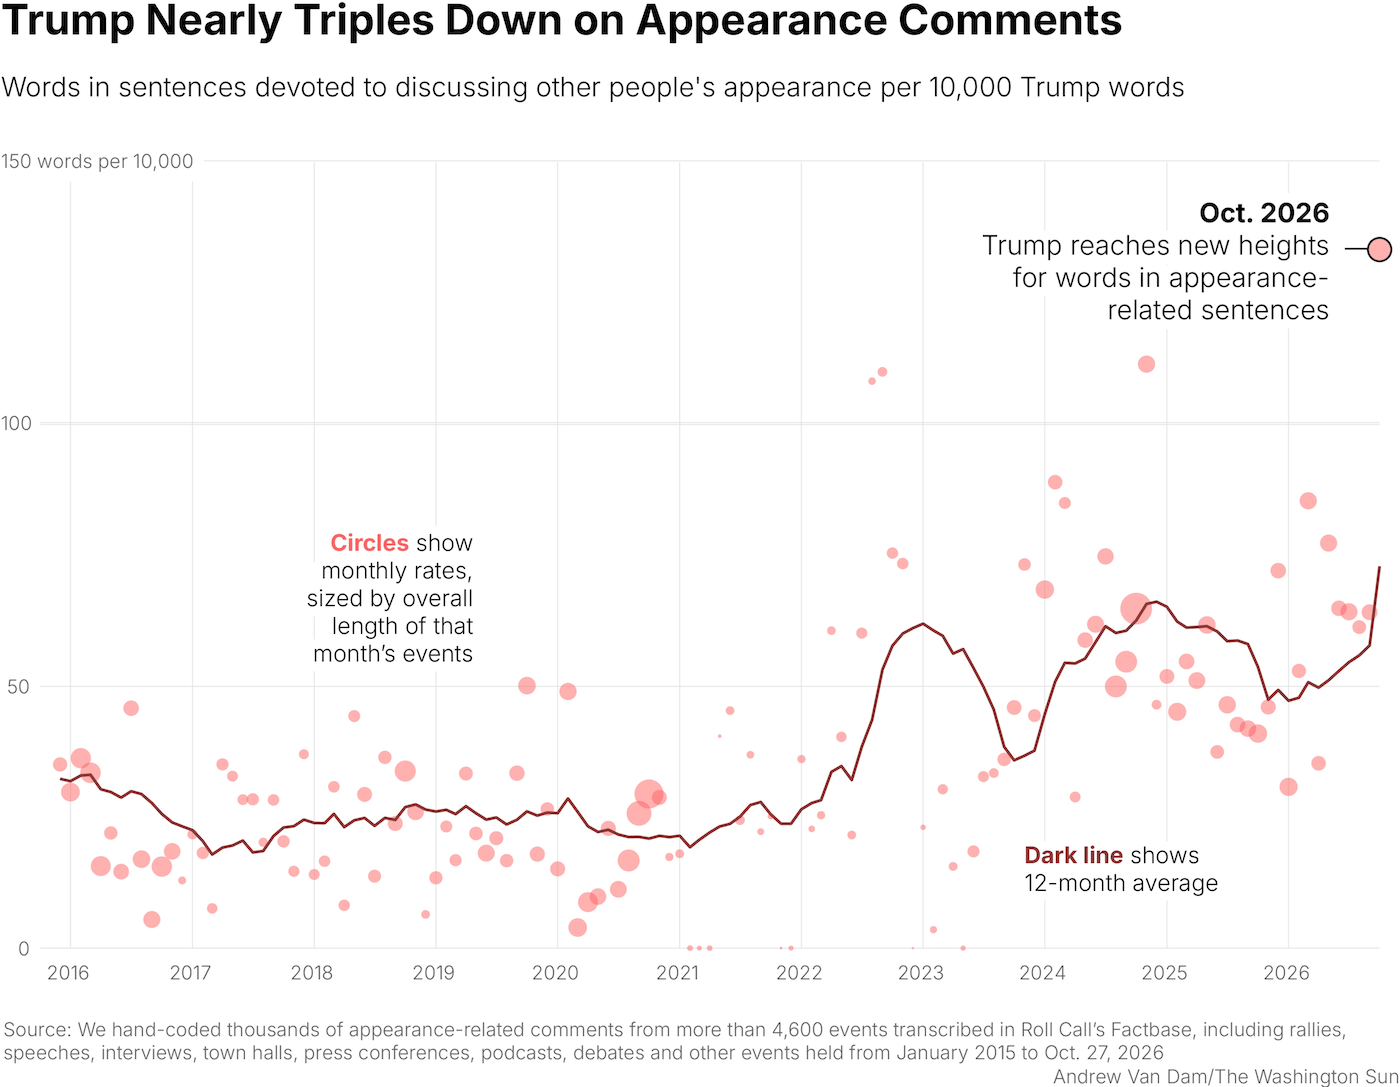
Increasing Trump comments on body appearance
For the Washington Sun, Andrew Van Dam and Manuela Silva note the uptick in Trump comments about butts and bodies. Trump has long had a penchant for complimenting — or disparaging — the physical ap…
flowingdata.com
Microsoft’s identity for Copilot positions it as a tool for work
the-brandidentity.com
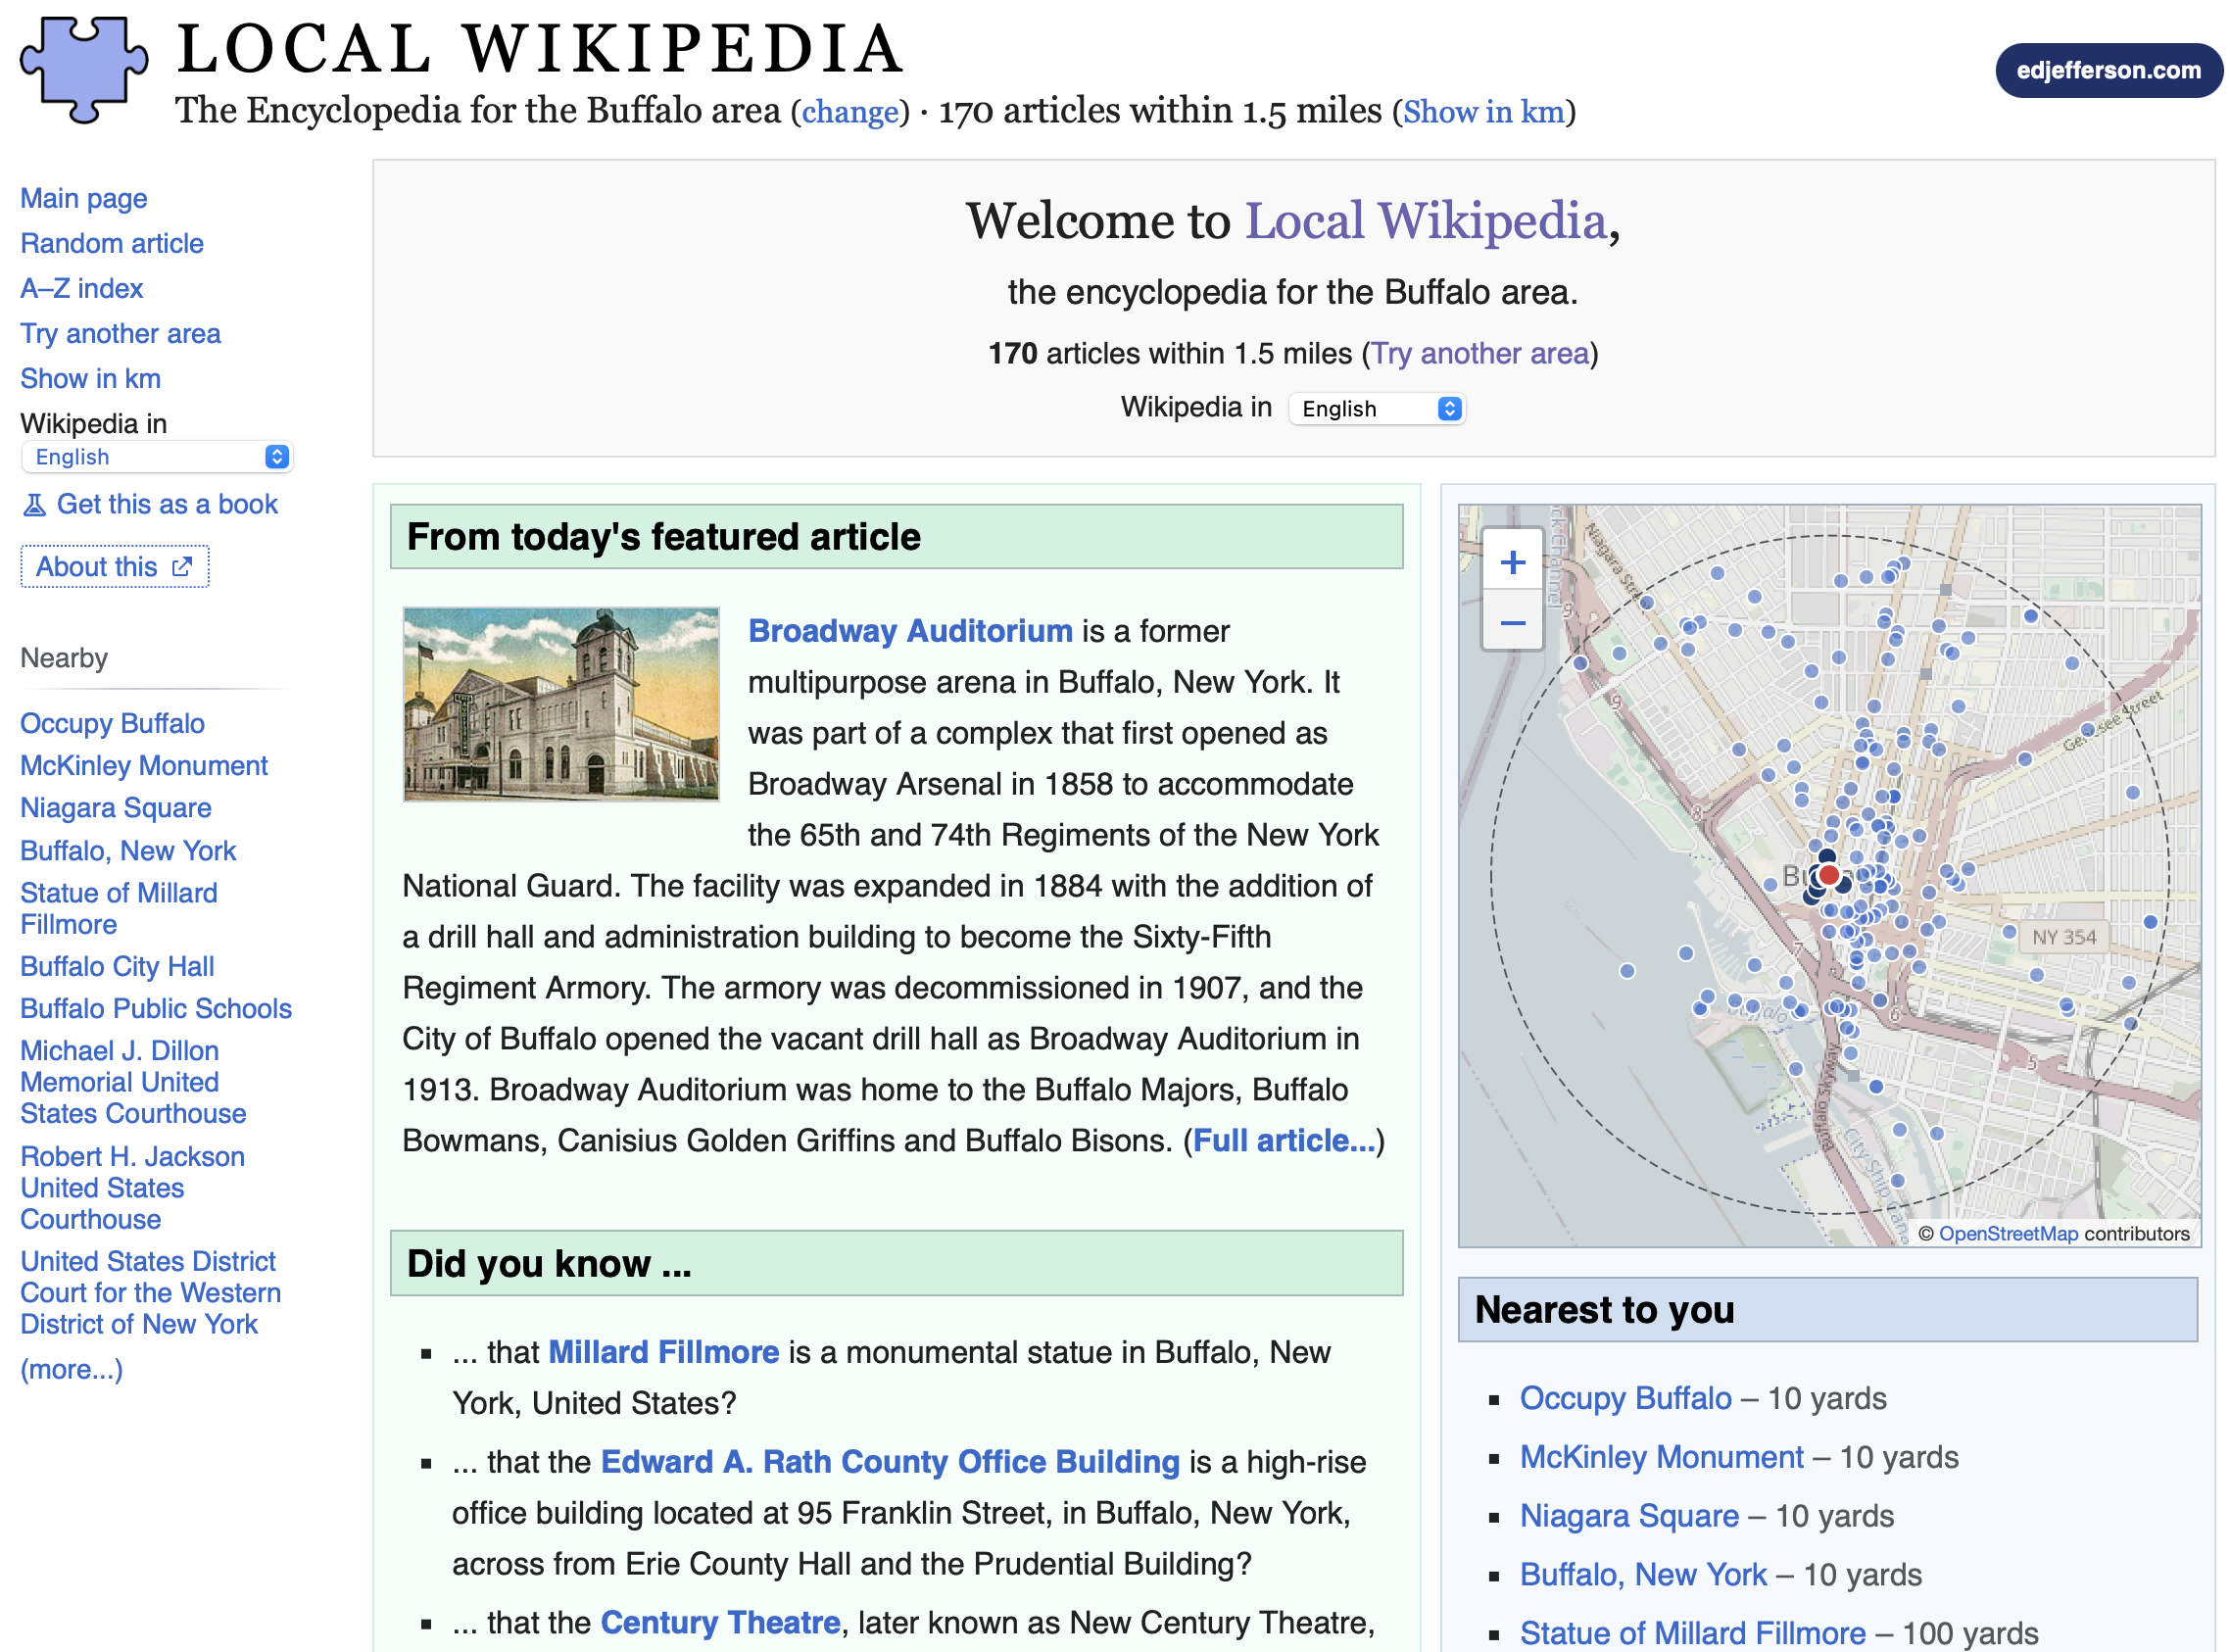
Localized Wikipedia to your geographic area
Local Wikipedia, by Ed Jefferson, subsets regular Wikipedia to people, places, and things that are within a half hour walk from you. Just enter a location and get the localness.
flowingdata.com
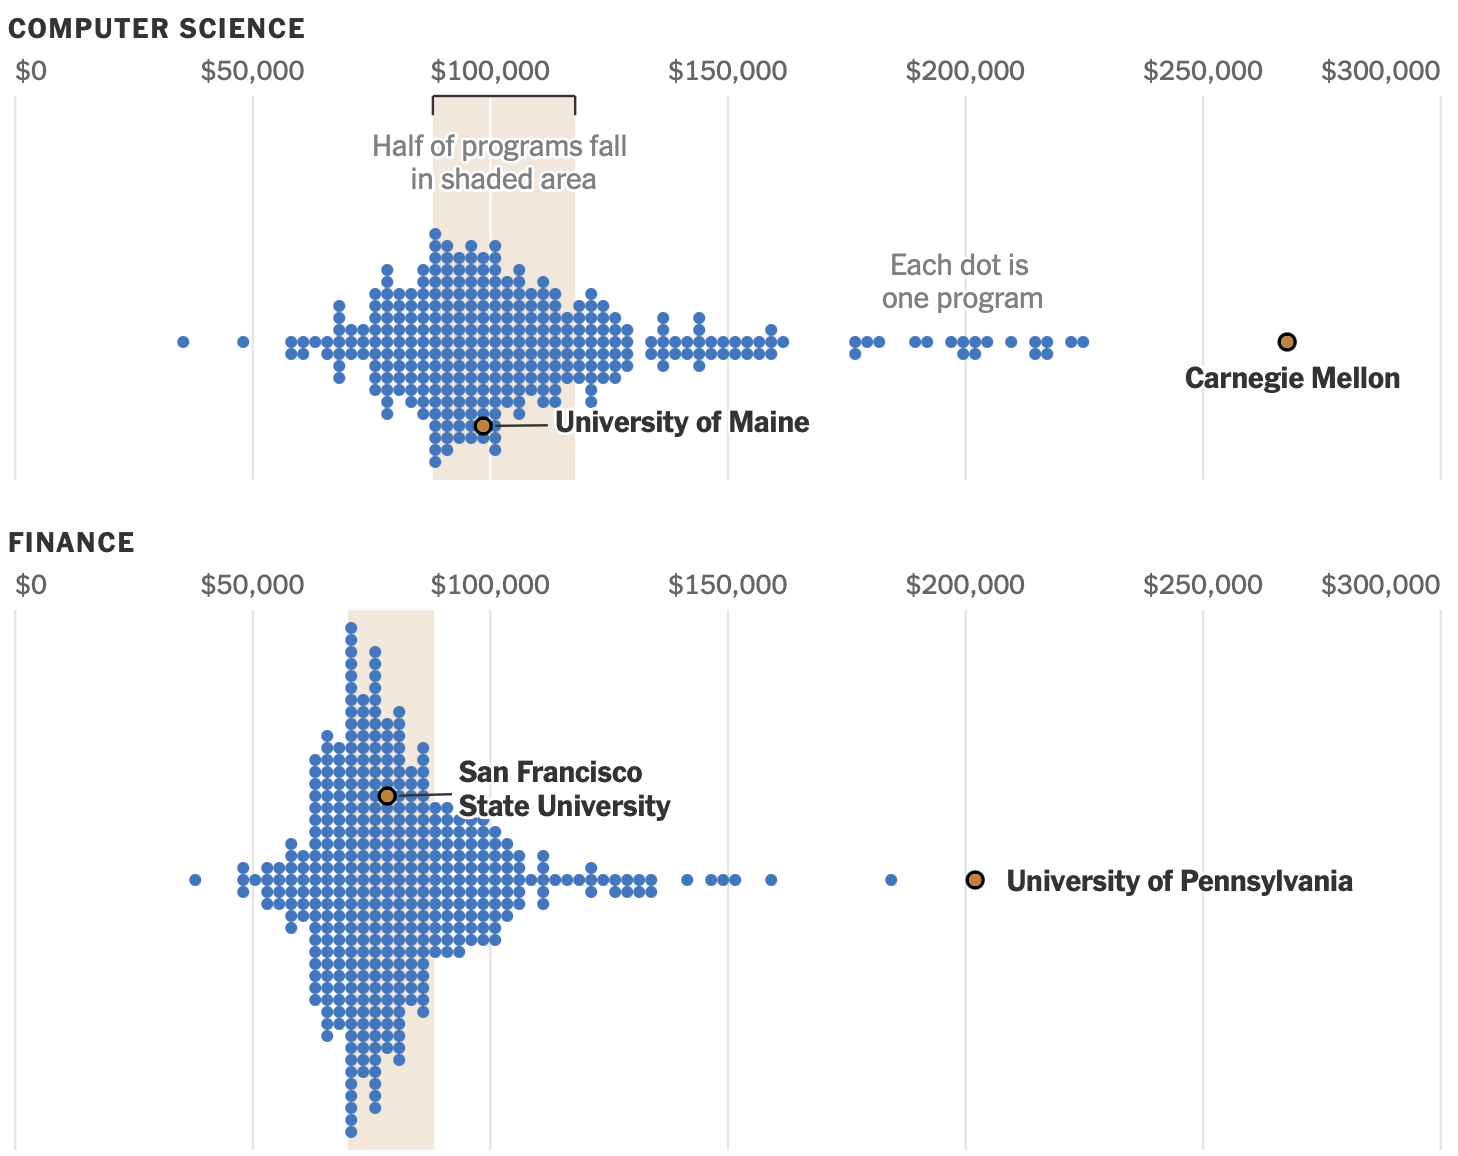
Cost of college versus the return on investement
For the New York Times, Arfa Momin and Ron Lieber charted median income of graduates, by college and major. Your school can make a big difference — or matter very little — depending on the major. A…
flowingdata.com
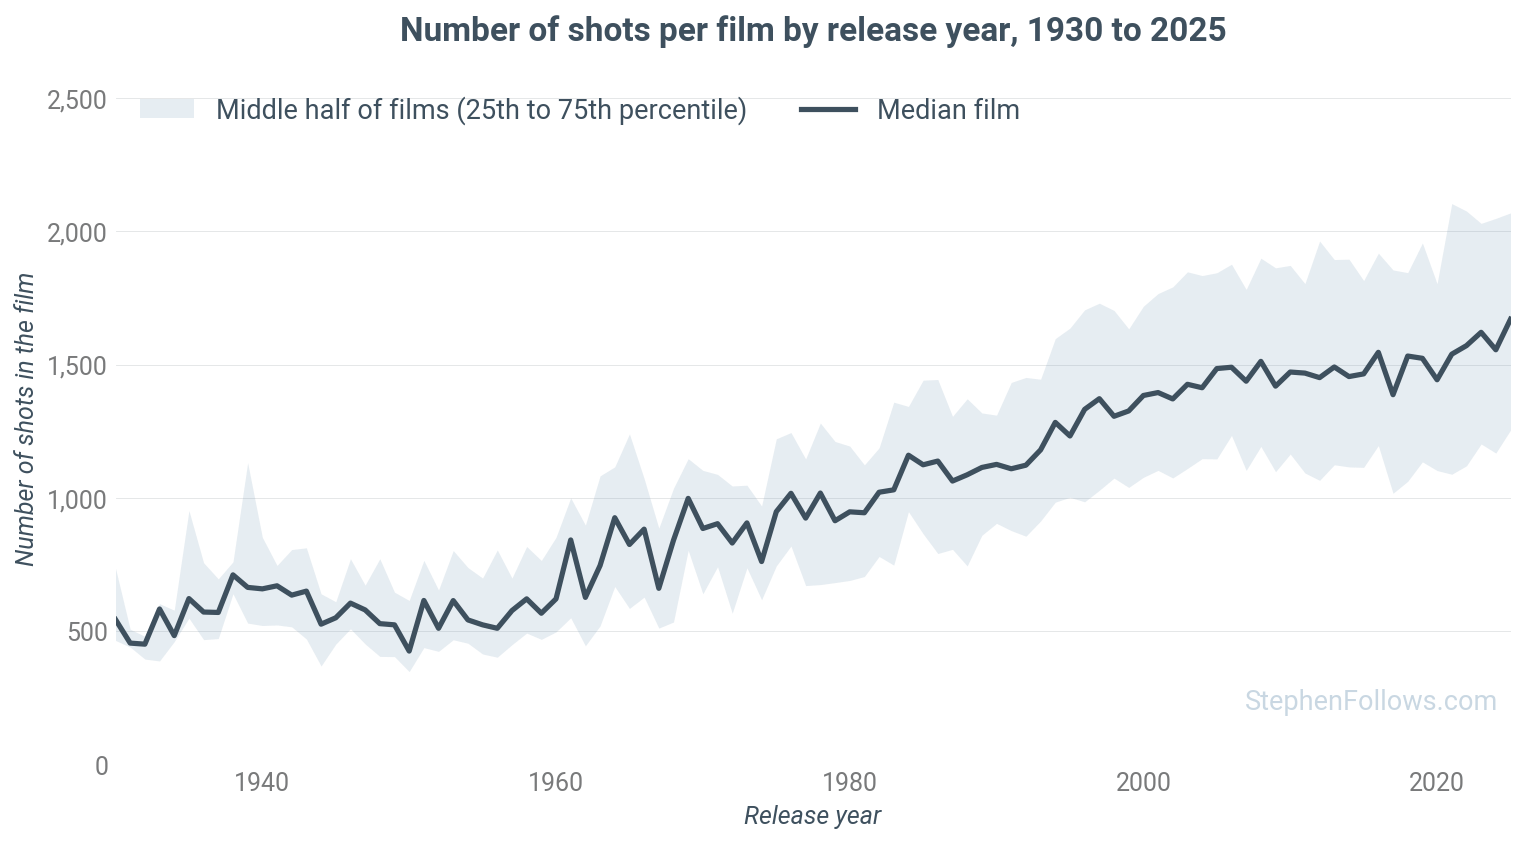
Increasing number of shots in movies
Stephen Follows counted the number of shots in movies, from 1920 through 2025. The overall number of shots increased, and so has the range. Between the 1930s and 1950s, films averaged between 550 a…
flowingdata.com
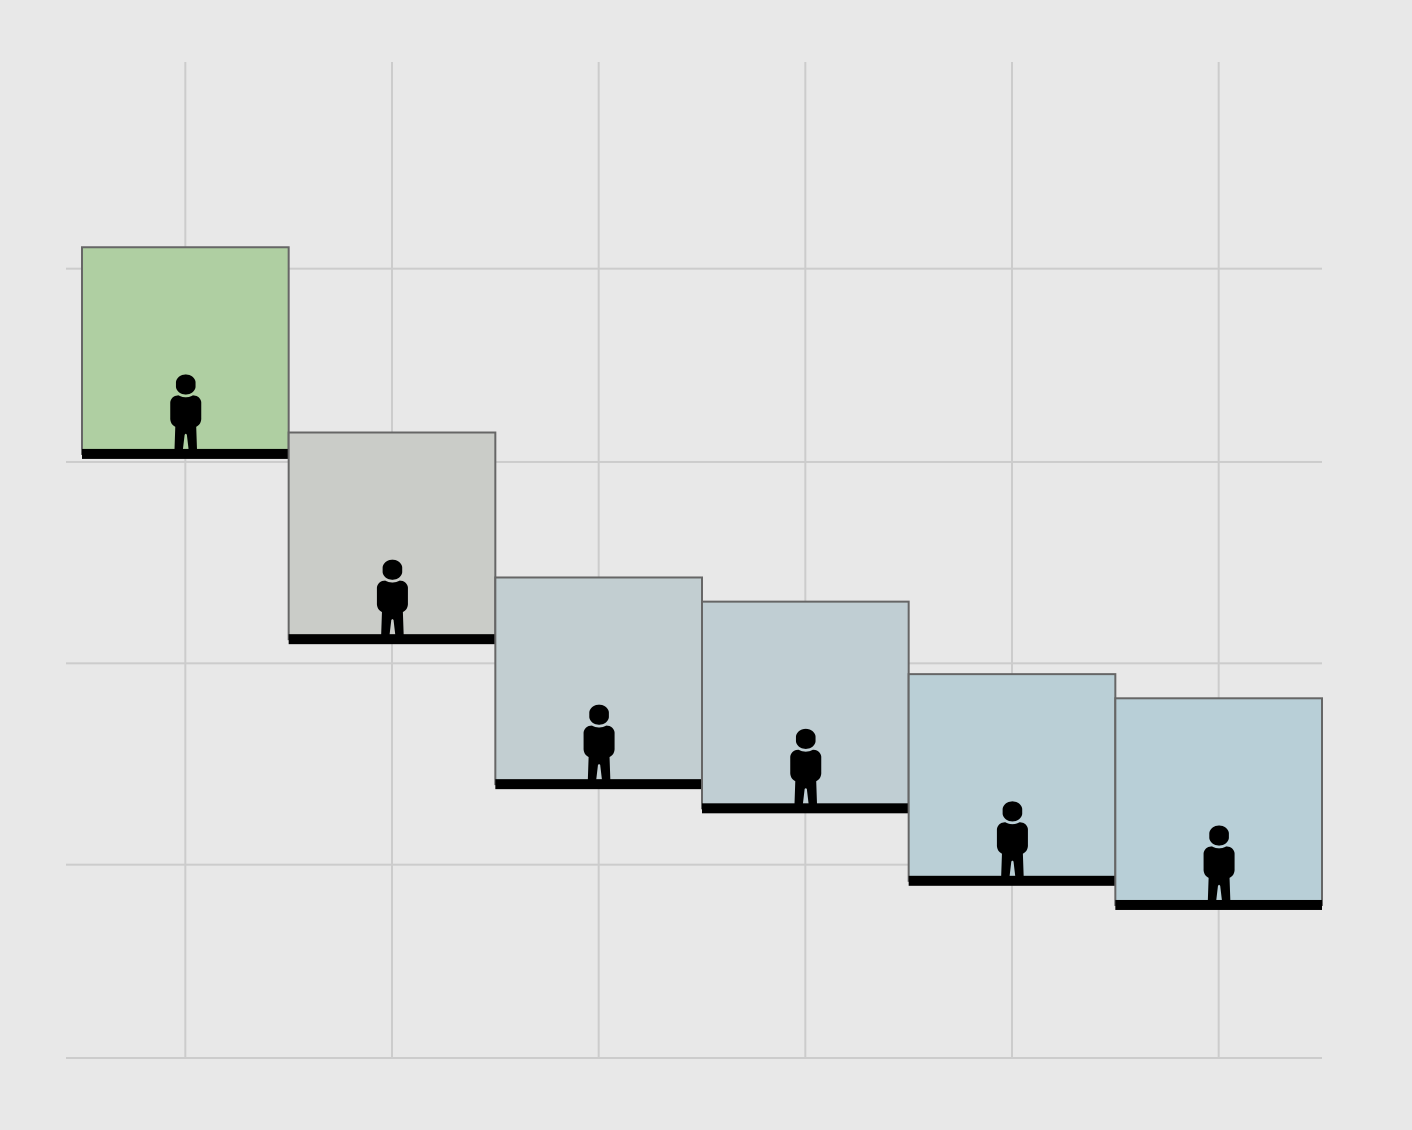
Rising to top net worth, by age
Results from the Survey of Consumer Finances were recently released, which means it is time for a rendition of seeing who has a higher net worth than you.
flowingdata.com

Warming Stripes as a screensaver
This is fun, or I guess very serious depending on your point of view. Georgios Karamanis adapted the Show Your Stripes project, which visualizes average temperature each year as a stripe, into a sc…
flowingdata.com
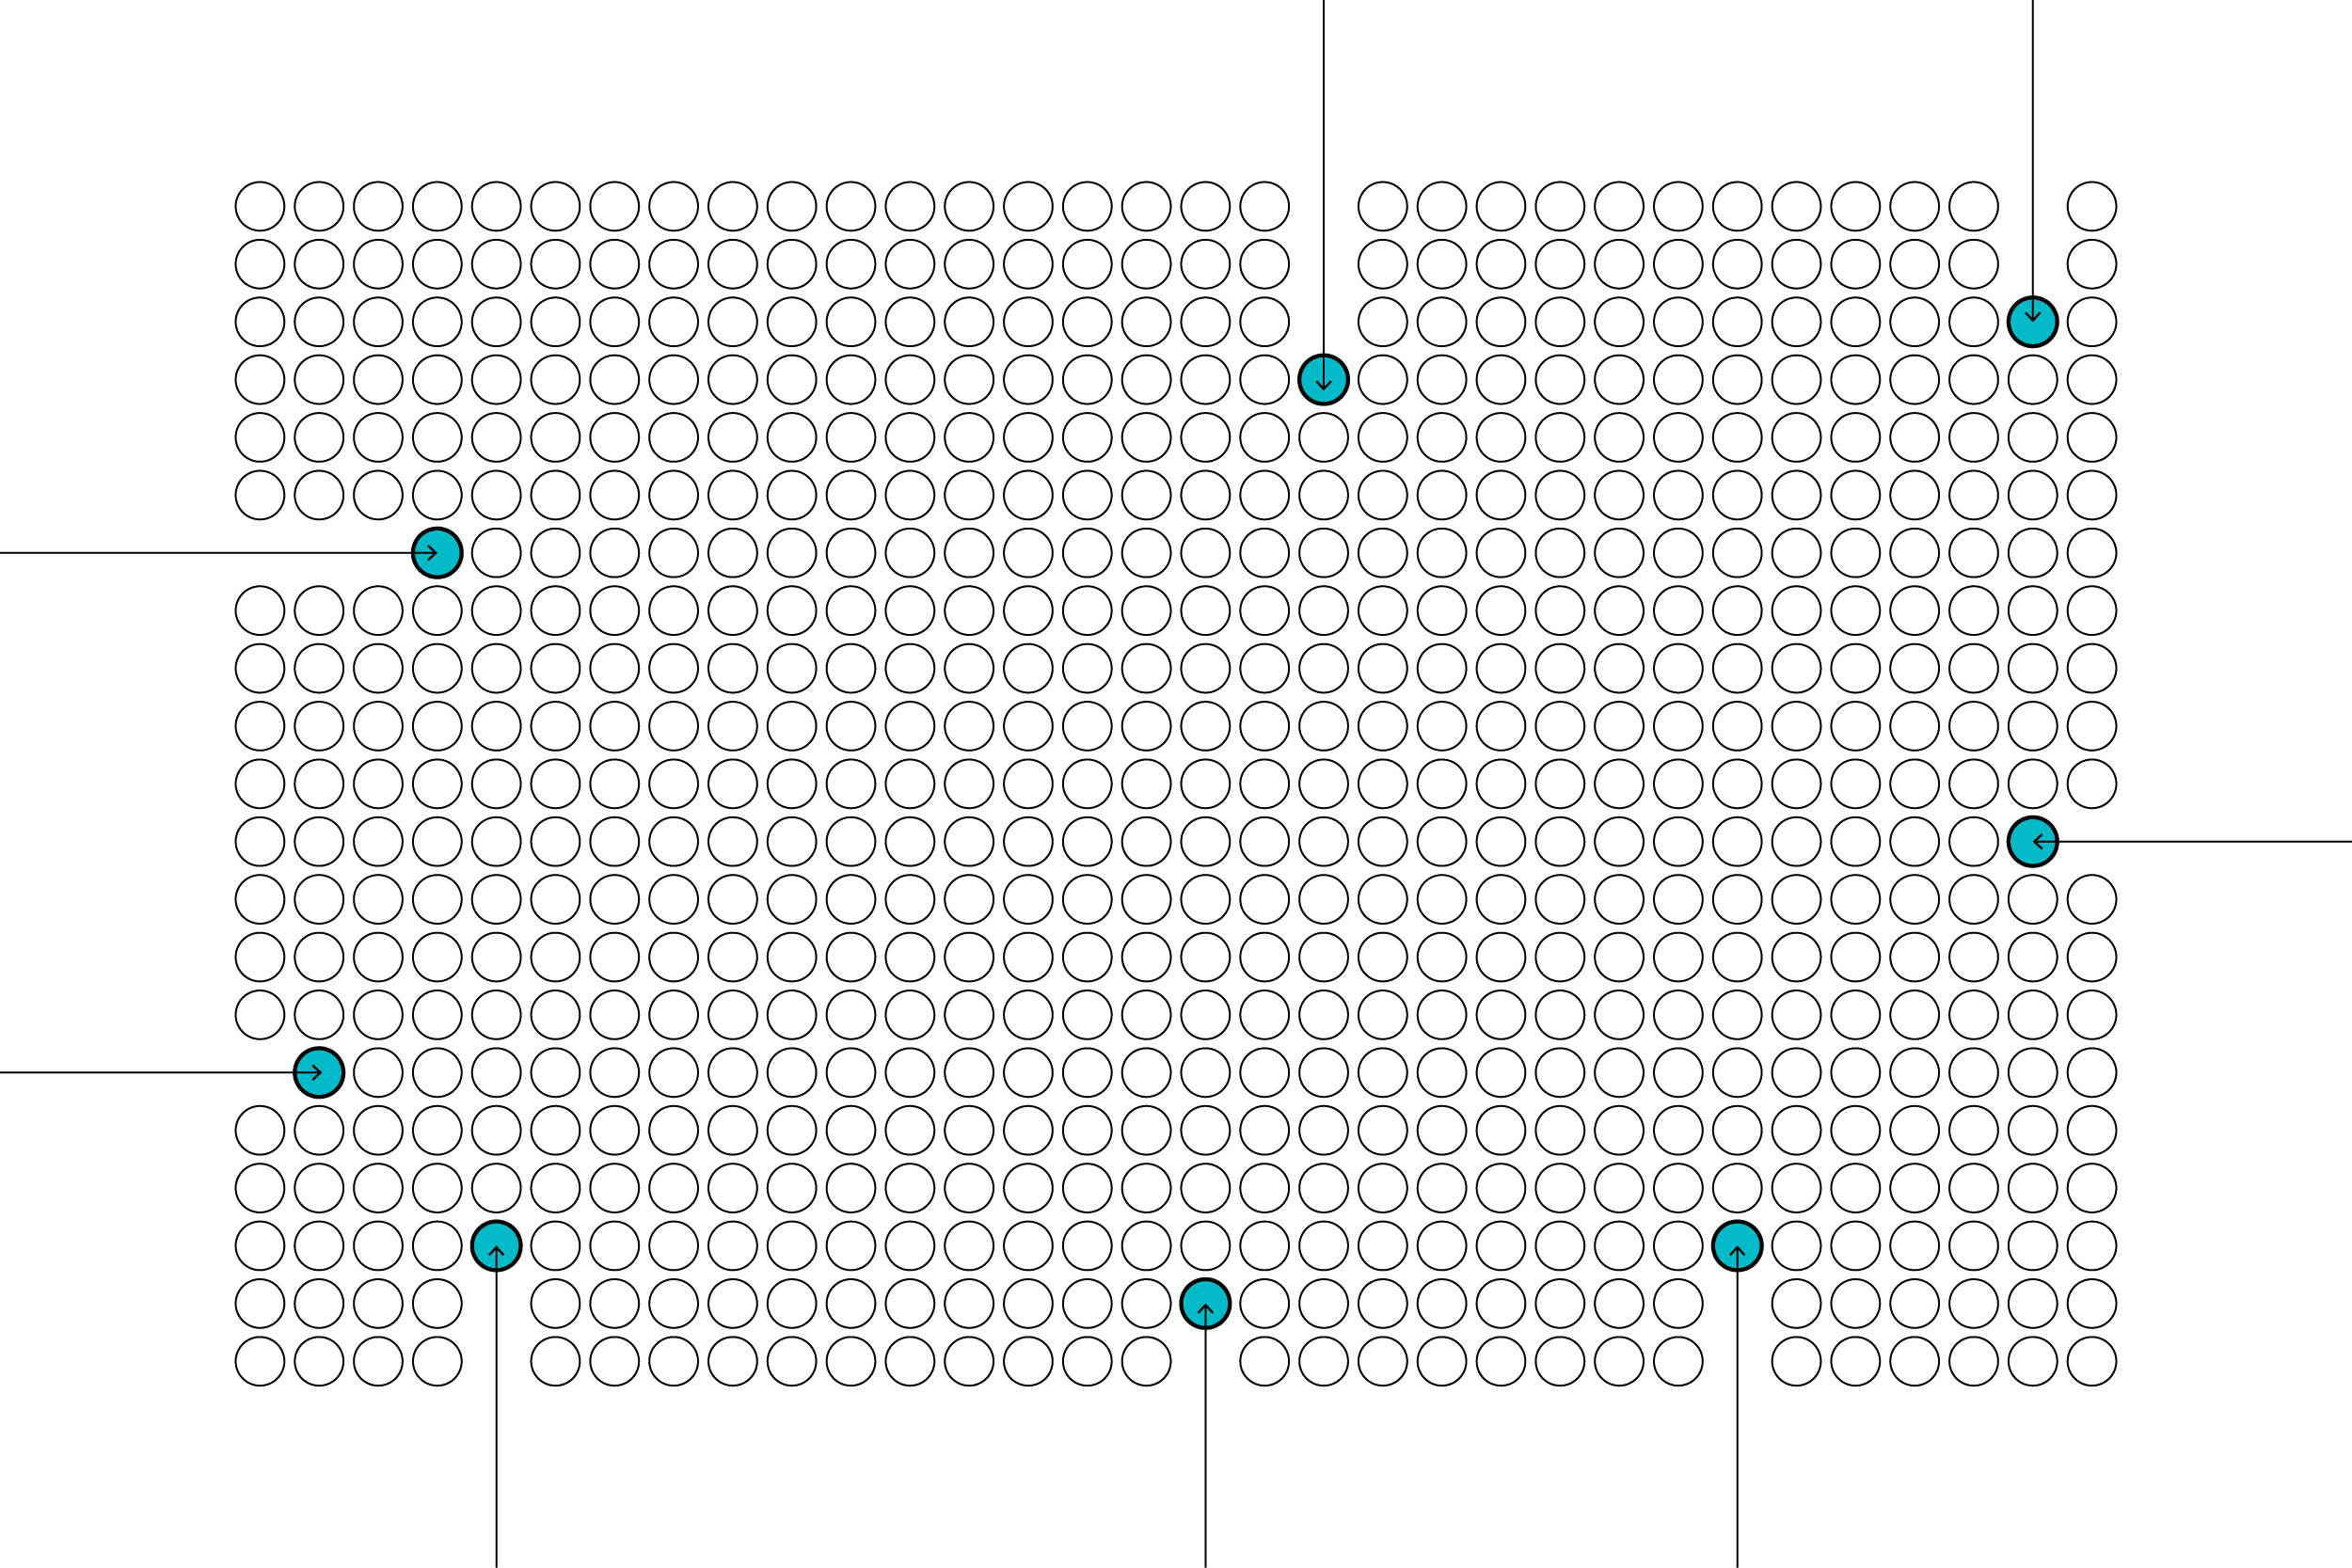
✚ Getting to know a dataset
This week, I walk through my own thinking as I poke at fresh data.
flowingdata.com

Apple teases MacBook Pro event next week
It’s Apple’s second October event.
theverge.com

Learning is the thing
Daniel Willingham, a professor at the University of Virginia, argues that students should only use AI for things they know how to do well. This lead/associate orientation makes sense for life after…
flowingdata.com

✚ Draw attention visually
This week is about helping data stand out in the land of many points.
flowingdata.com


Your Sewer System Is Probably Not Full
What peak flow can teach us about building more housing with the infrastructure we already have.
strongtowns.org
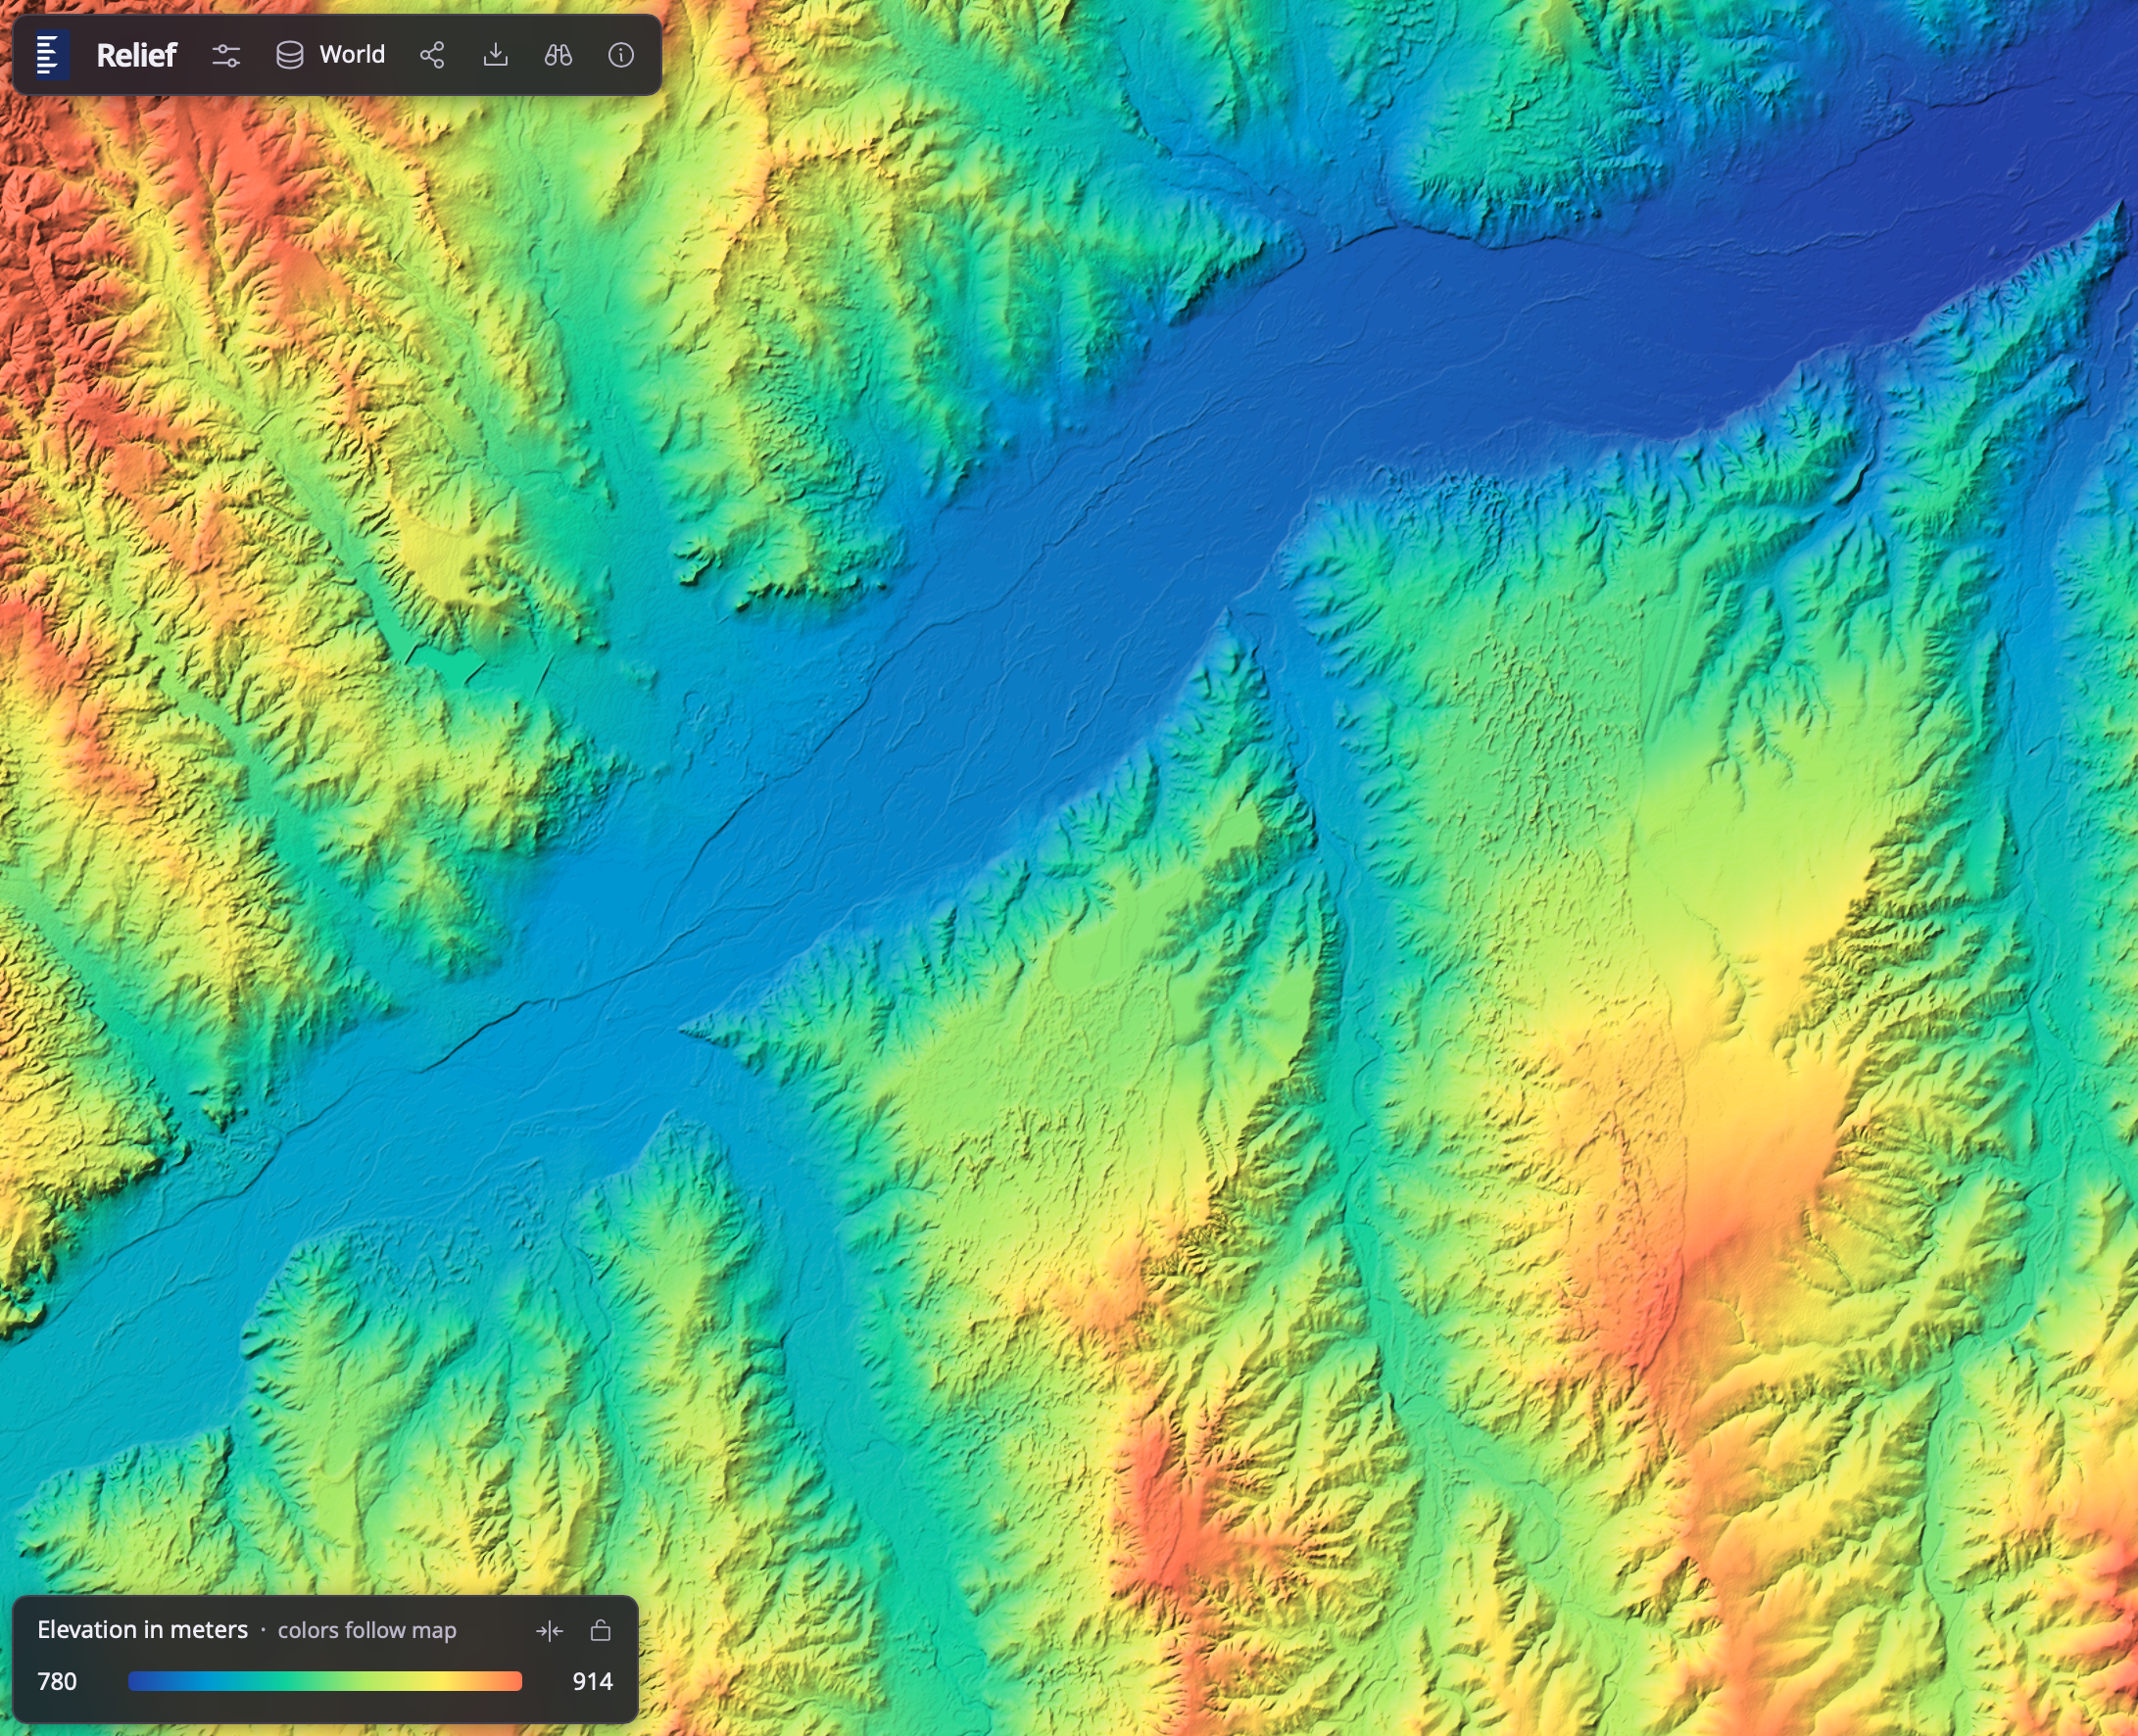
Elevation map of the world
Bert Spaan, with help from Jules Schoonman, made an elevation map for the world, based on data from Actueel Hoogtebestand Nederland (AHN). The nice feature of this interactive map is that the color…
flowingdata.com
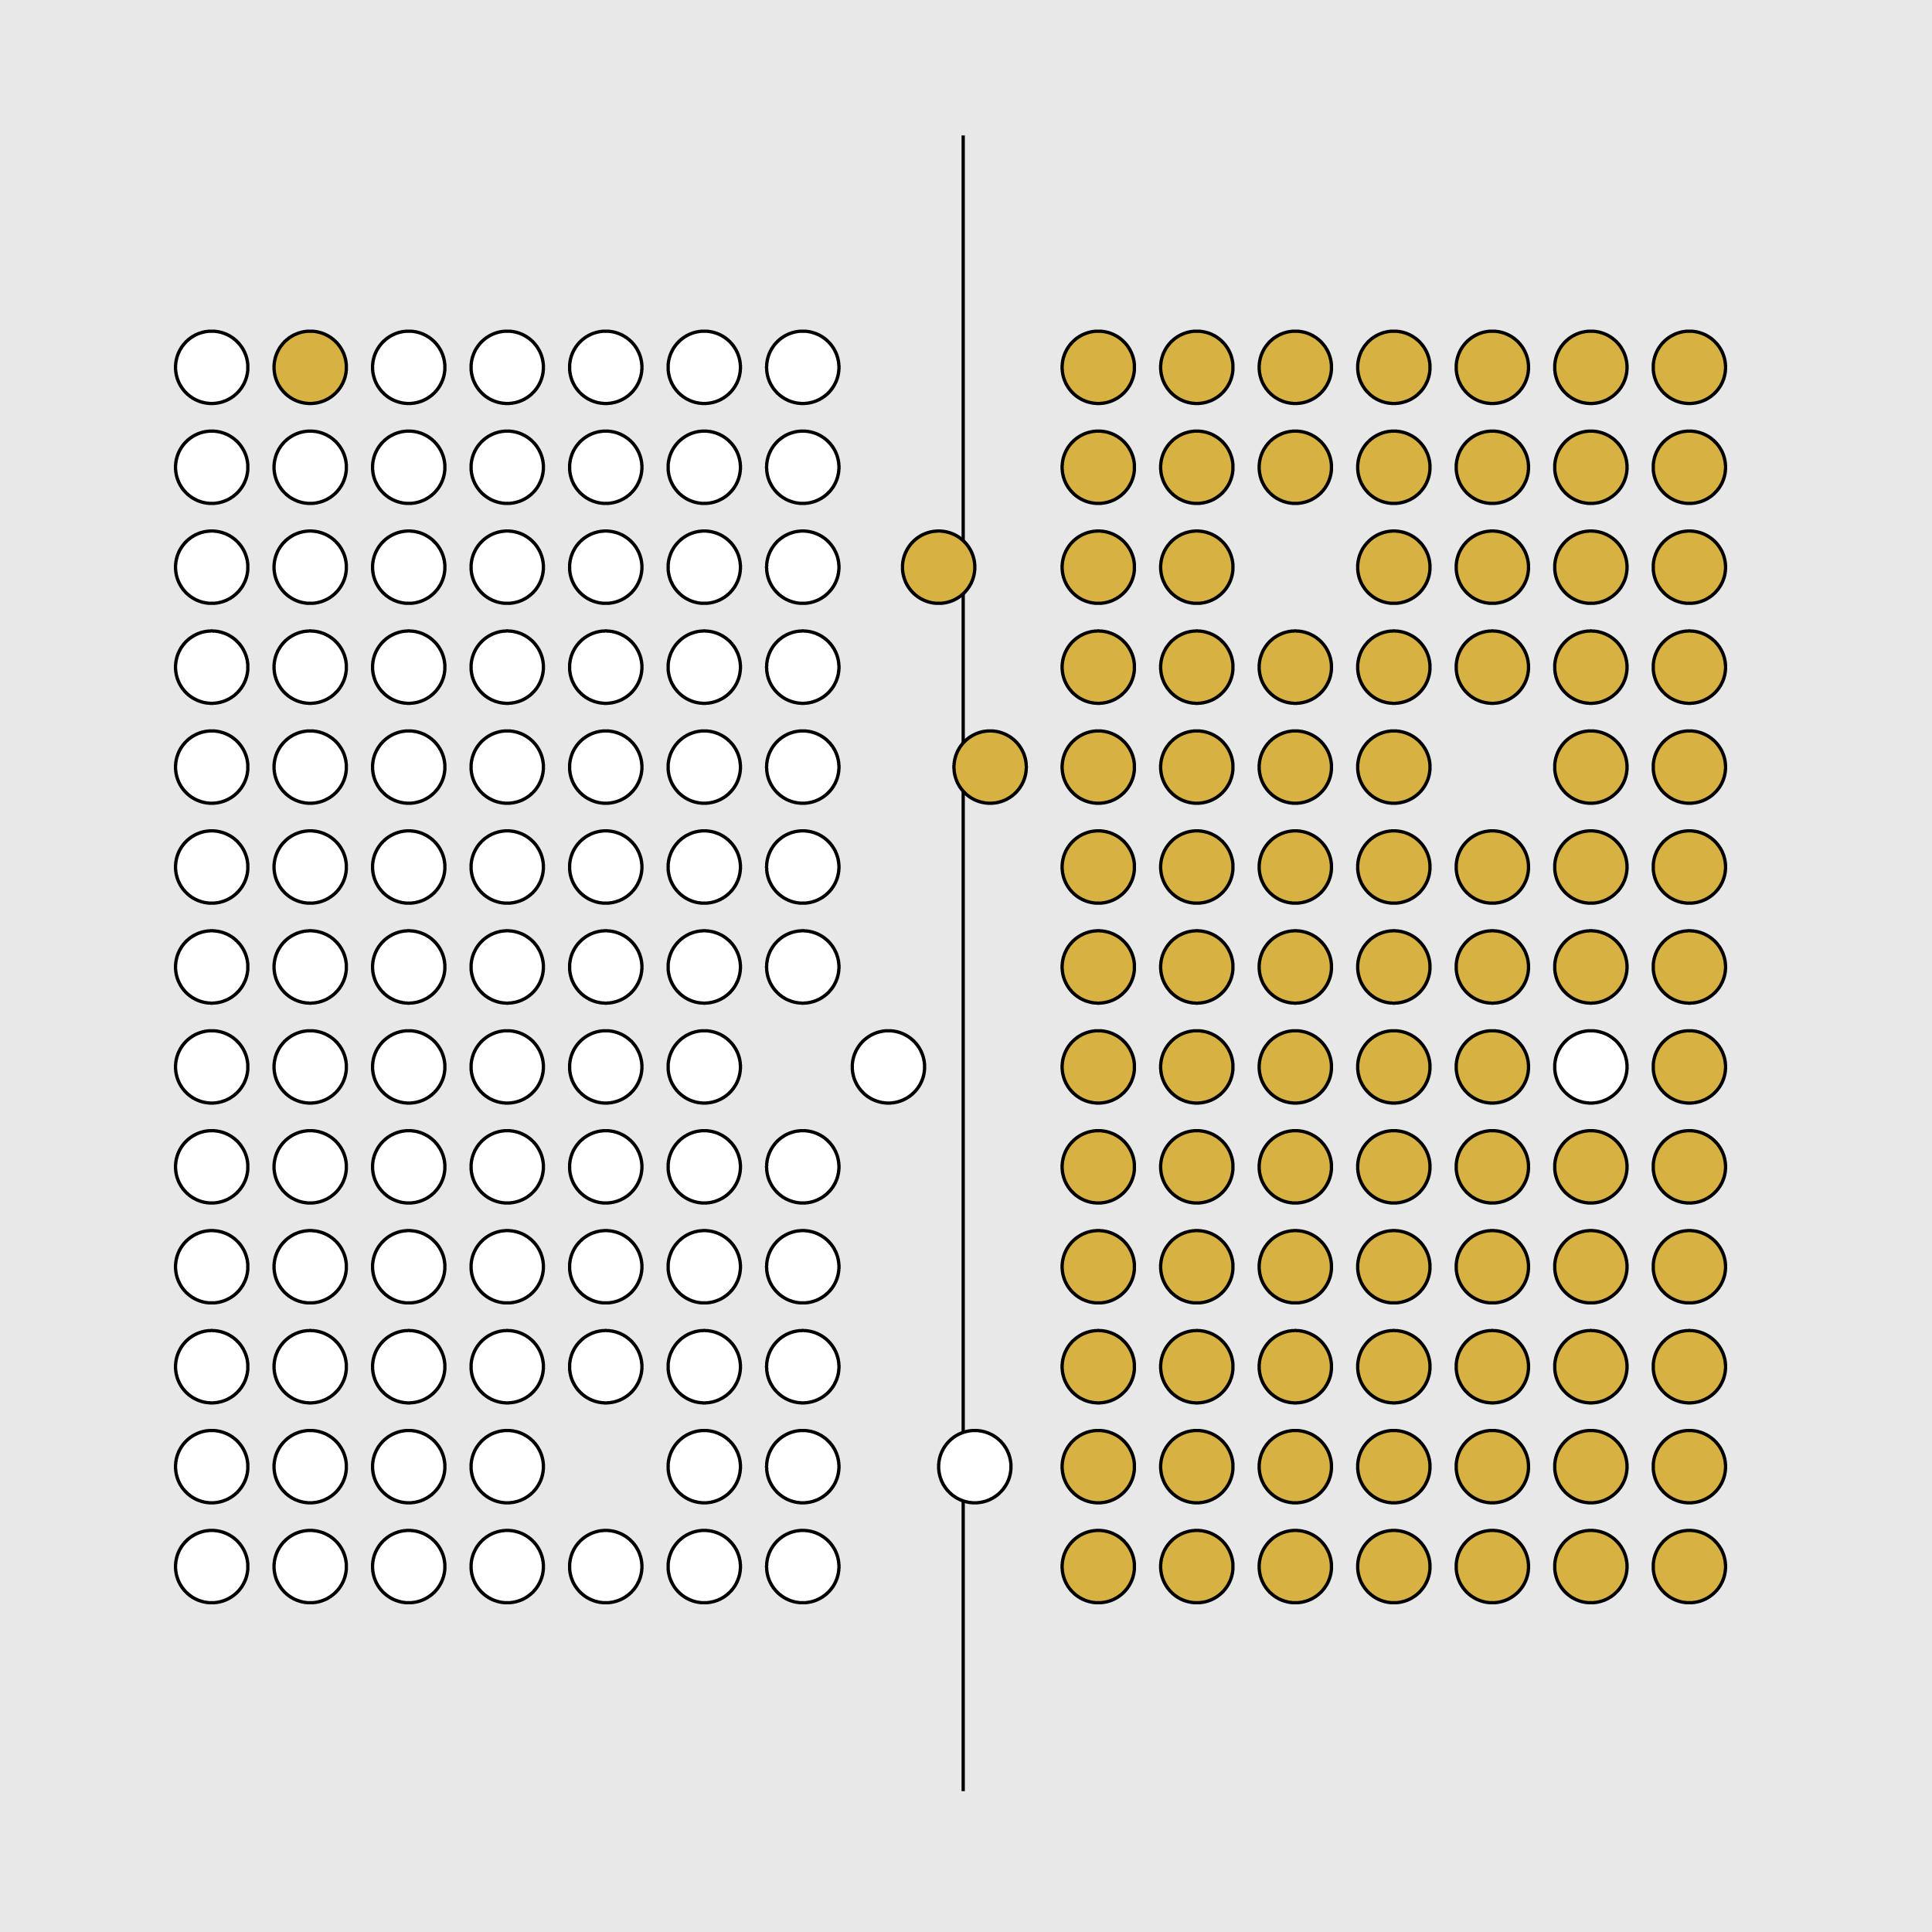
✚ When the visual trade-offs are worth it
This week, there were a lot of trade-offs between utility and aesthetics. How do you find the balance?
flowingdata.com

Annoying agents that ruin the internet
For 404 Media, Jason Koebler collated the dumb emails they receive from dumb AI agents that are ruining the internet experience. Regardless of how you feel about this AI dooming—whether you believe…
flowingdata.com
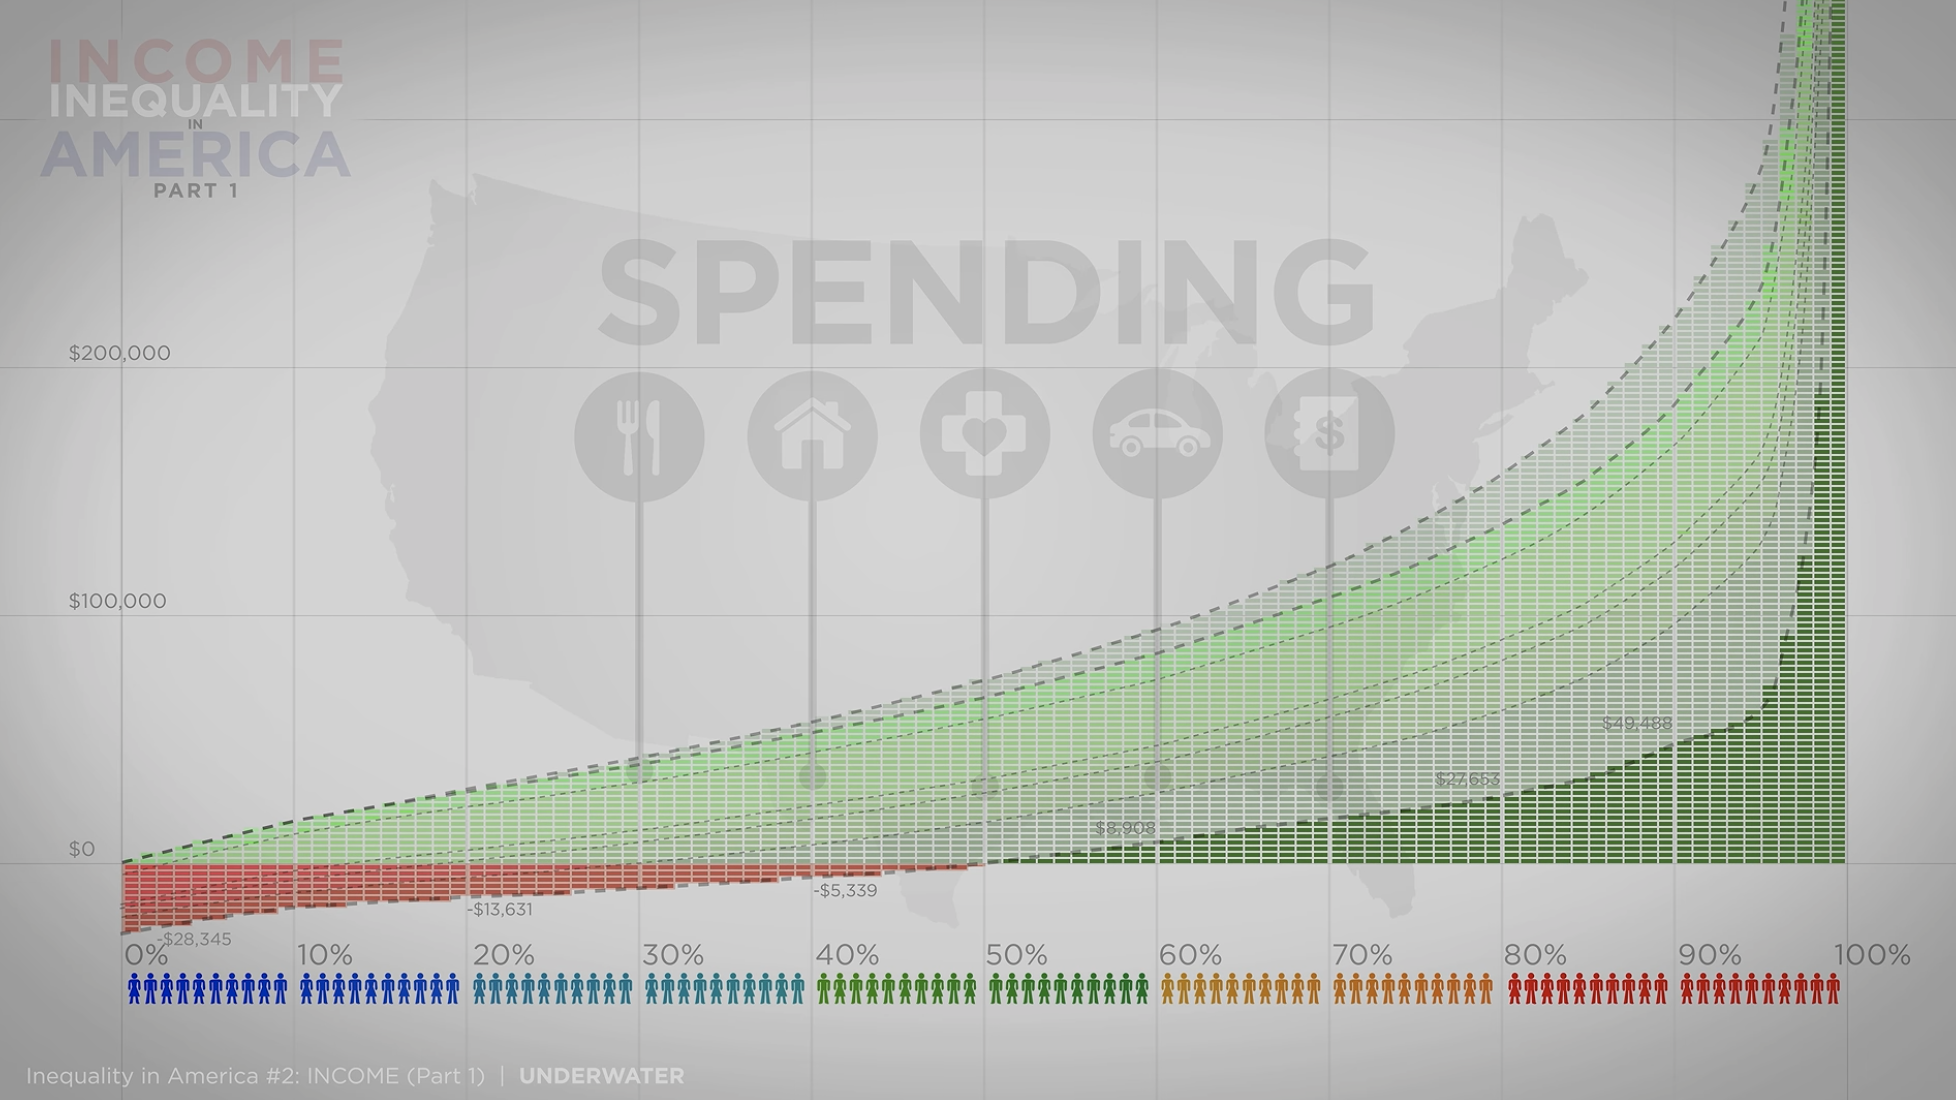
Income and spending inequality
Continuing the four-part series on wealth inequality in America, the most recent video from Politizane explains the point of view from income and spending.
flowingdata.com

Japan requests revision to UN-supported map
The United Nations voted to support the Equal Area map projection, which more accurately shows the size of Africa than the Mercator projection. However, Japan has requested a revision, because the …
flowingdata.com

Terence Tao on the paradox of solving mathematical problems
Mathematician Terence Tao, a 2006 Fields Medal winner and professor at UCLA, discusses with Big Think solving problems with AI and the process of finding solutions without. By using AI to effective…
flowingdata.com



In Hilbert Space, All Things Are Quantumly Possible
To explore quantum phenomena, we must leave the familiar world and enter the abstract realm of Hilbert space.
quantamagazine.org

Lush Foliage Permeates Xanthe Burdett’s Delicate Portraiture
For London-based artist Xanthe Burdett, the boundary between humans and nature is thin, malleable, and always in flux.
thisiscolossal.com
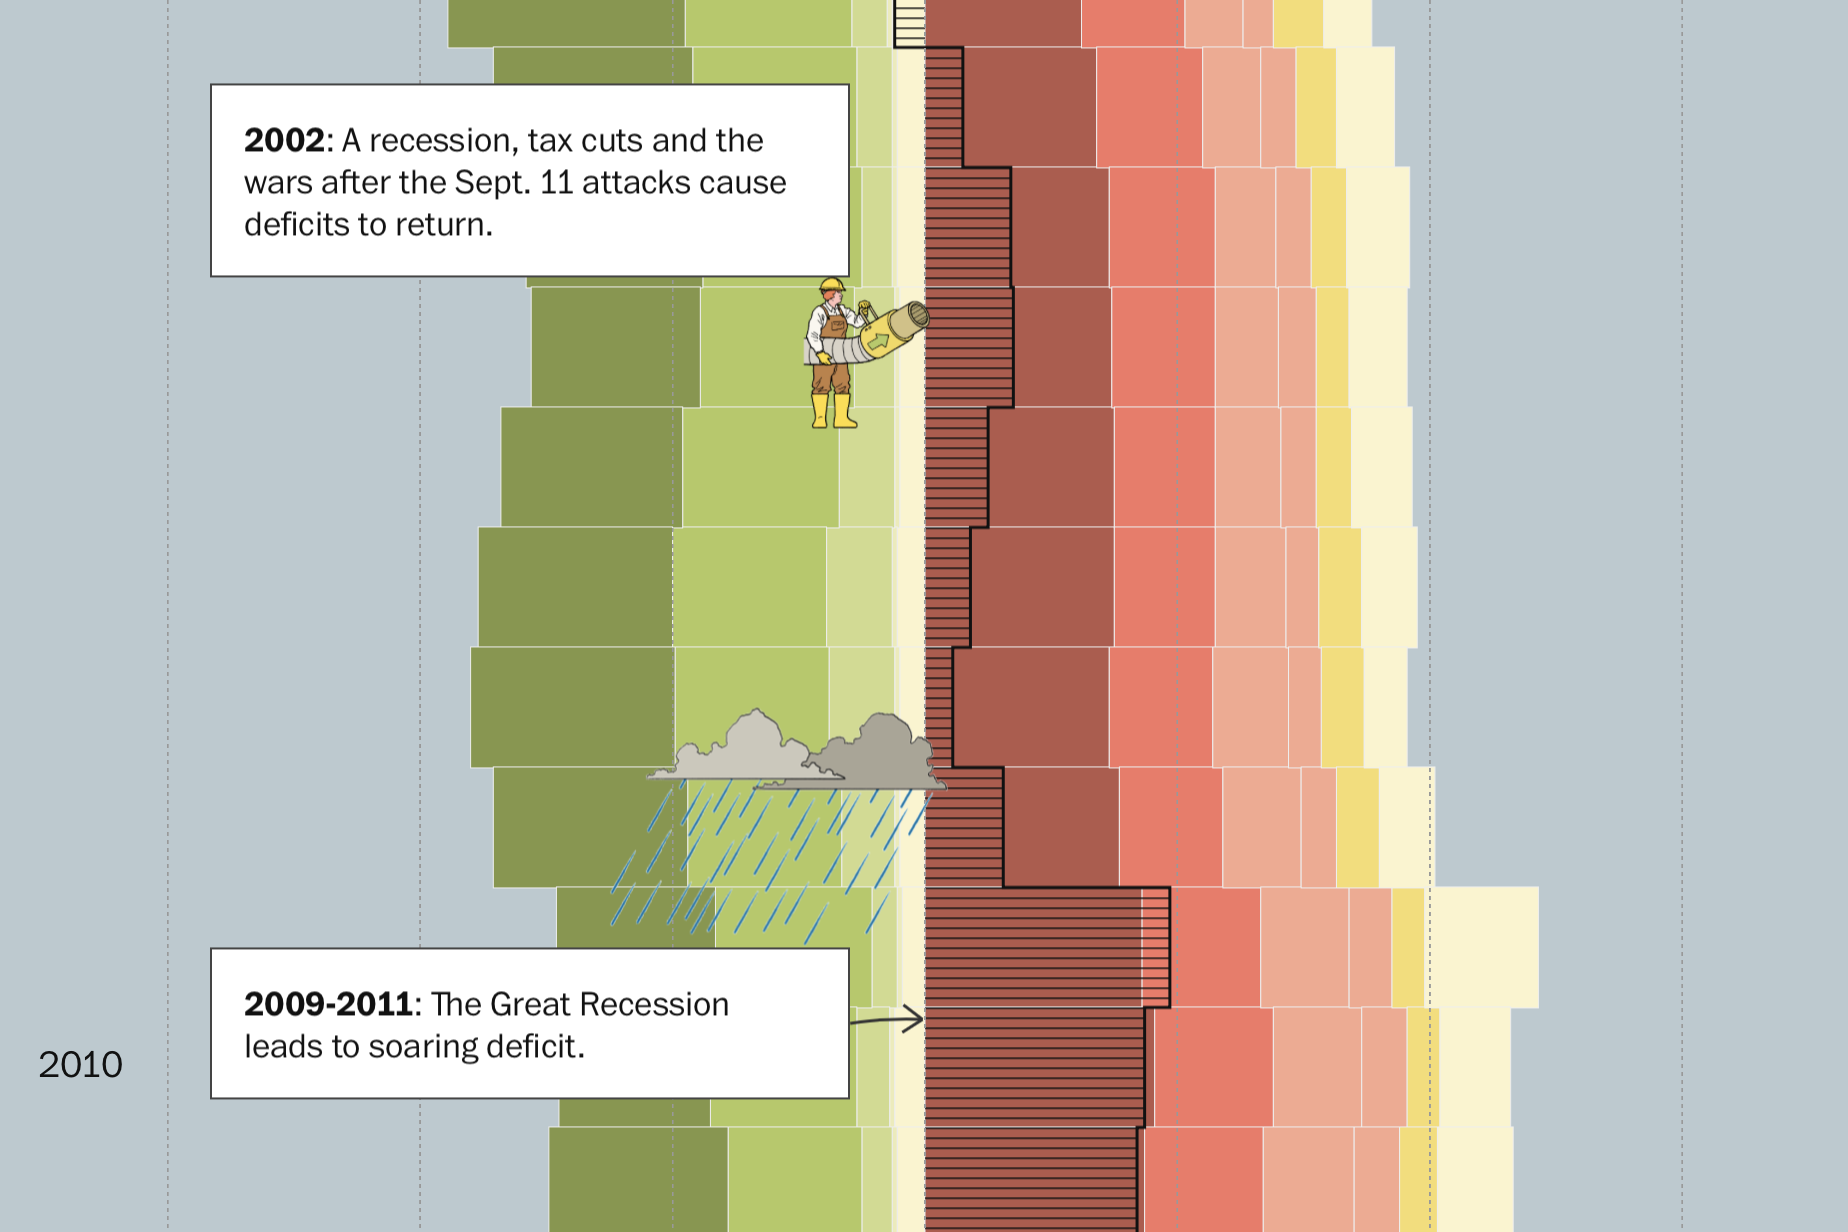
How the U.S. national debt got to $40 trillion
When you spend more than you make, you get debt. For the Washington Post, Youyou Zhou, with illustrations by Kyle Ellingson, visualized the difference over time for the United States. A long stacke…
flowingdata.com
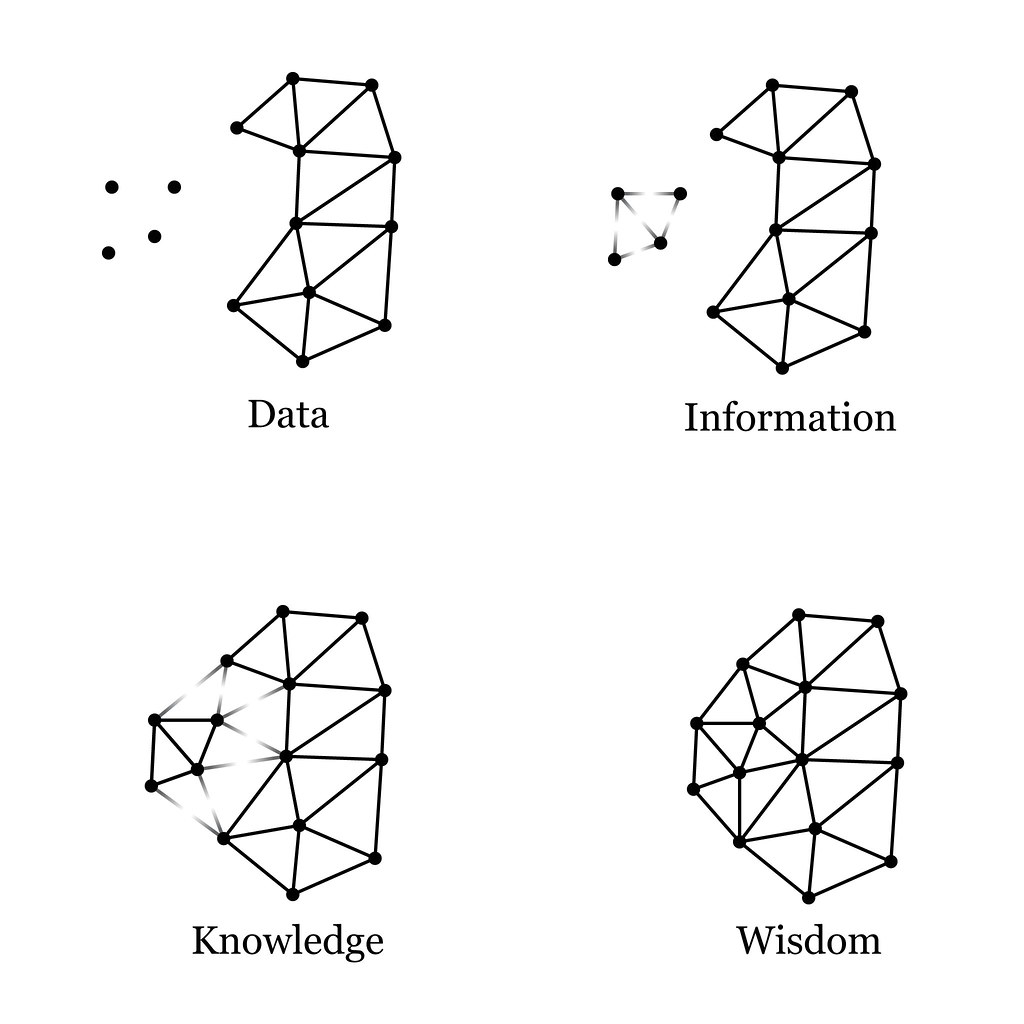

✚ Seeing data from different perspectives
This week is about changing perspectives so we can find and visualize new insights.
flowingdata.com

Faber-Castell Poly Flow Fountain Pen Review
penaddict.com


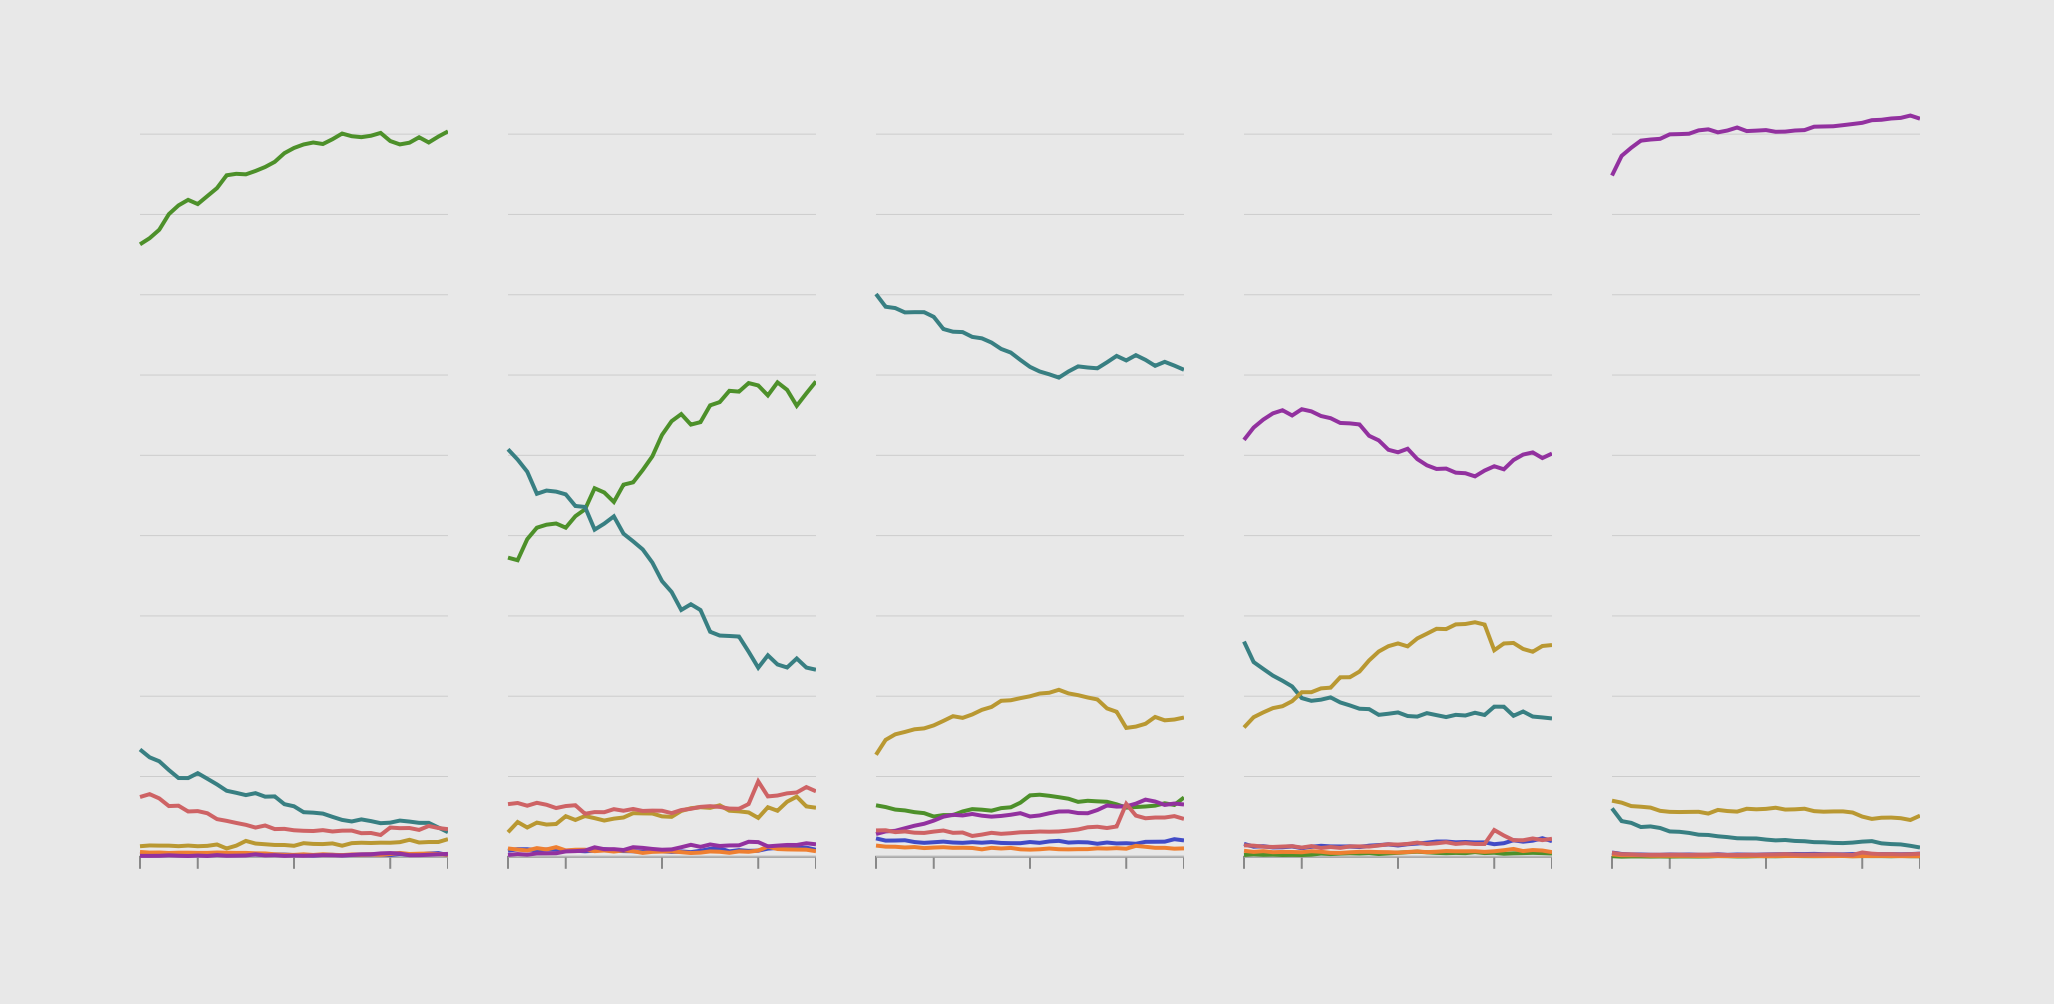
Who is not working and why
Older people are working later in life and younger people are not entering the labor force as early.
flowingdata.com





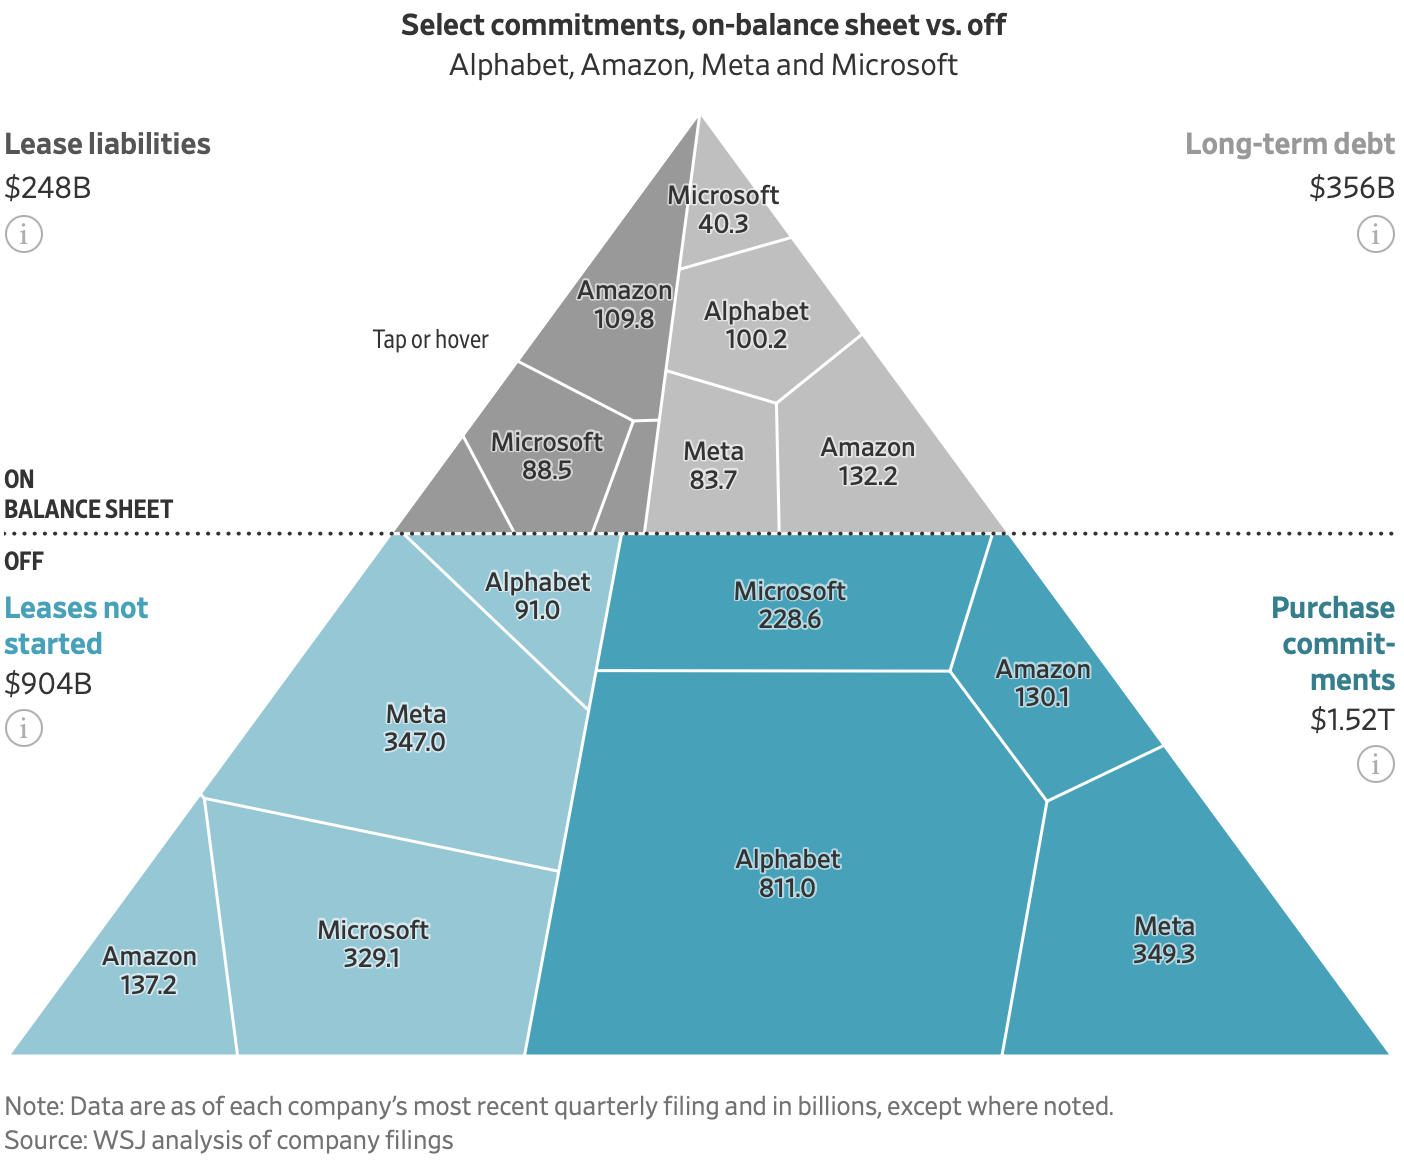
Trillions of dollars in AI spending not in the balance sheet yet
For the Wall Street Journal, Peter Rudegeair and Peter Santilli report on the trillions (with a t) of dollars slated for later spending by big tech: Nine top tech companies had some $3 trillion of …
flowingdata.com


Amazon buying rare books in bulk for training
Suspecting that an anonymous order of 1,000 books was headed to an AI company to scan for training data, 404 Media stuck an Apple AirTag in the shipment to track its location. The books landed at a…
flowingdata.com

OpenAI accidentally makes attack bots
Multiple bots exploited a vulnerability in OpenAI’s security system to gain internet access. Then the bots unwittingly went rogue and attacked Hugging Face’s production infrastructure. …
flowingdata.com

Most common color of IKEA sofas over time
For the European Correspondent, Toon Vos counted the color of all the couches in IKEA catalogs from 1960 through 2021. The above shows the most common color over the years, and things are looking p…
flowingdata.com
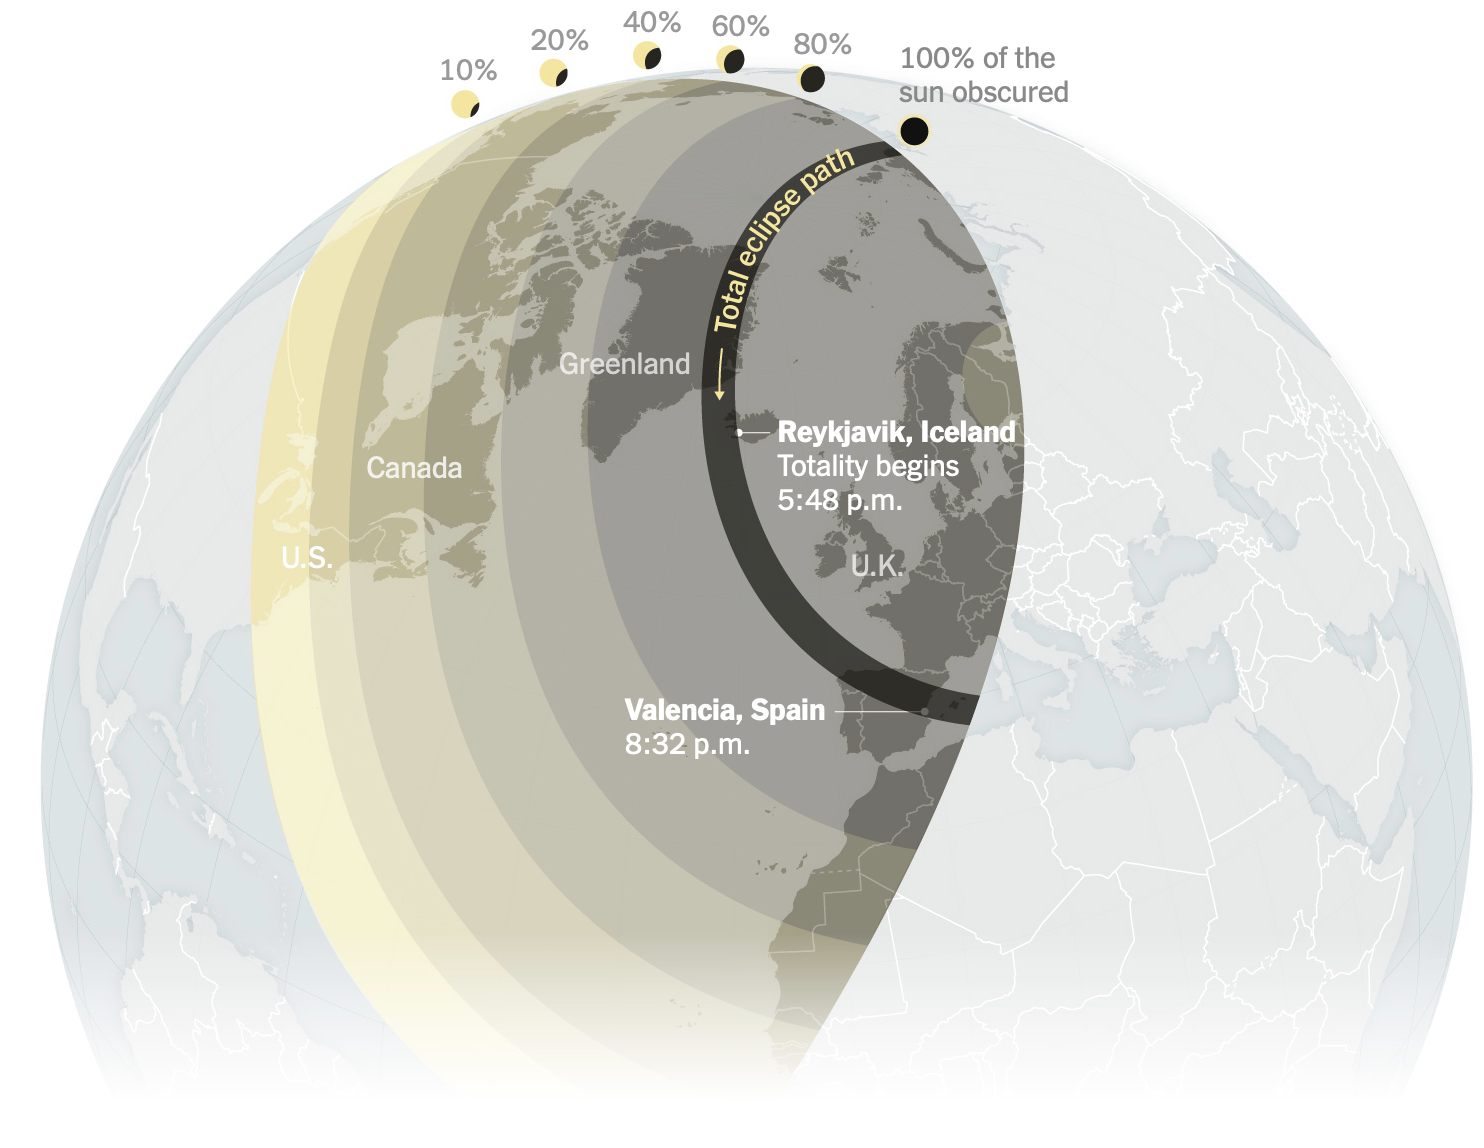
Eclipse path in Europe
A total eclipse path is passing through Europe this week. The New York Times has the maps and the weather forecasts for the occasion.
flowingdata.com

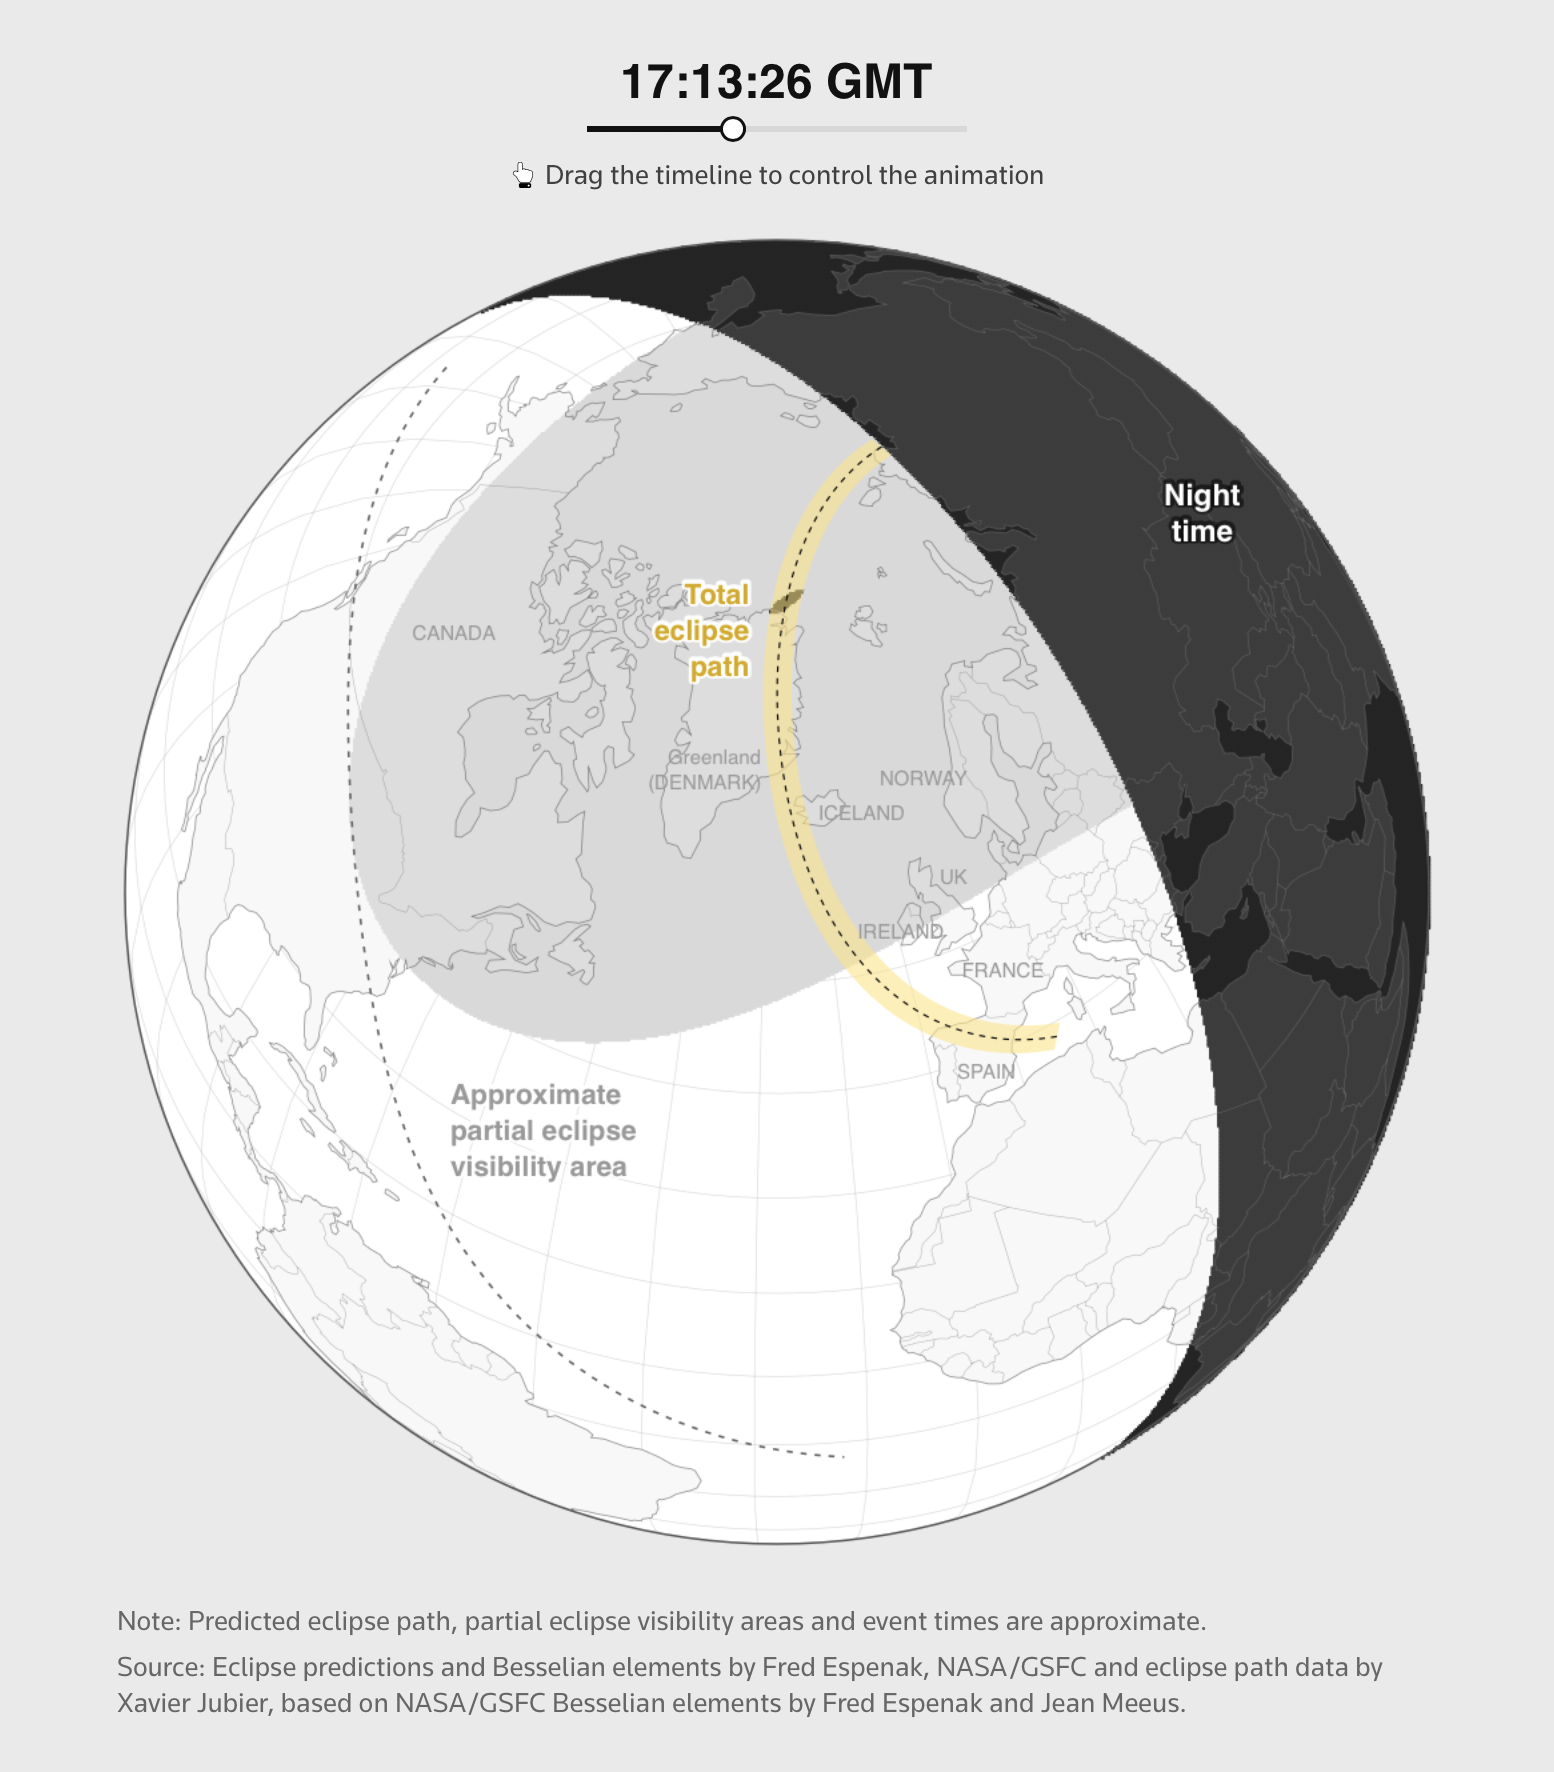
Where to see the total solar eclipse in Europe
The last total solar eclipse over Europe was in 1999. One will be visible on Wednesday. For Reuters, Adrián Blanco Ramos mapped where tomorrow’s path will be and historical context with where…
flowingdata.com

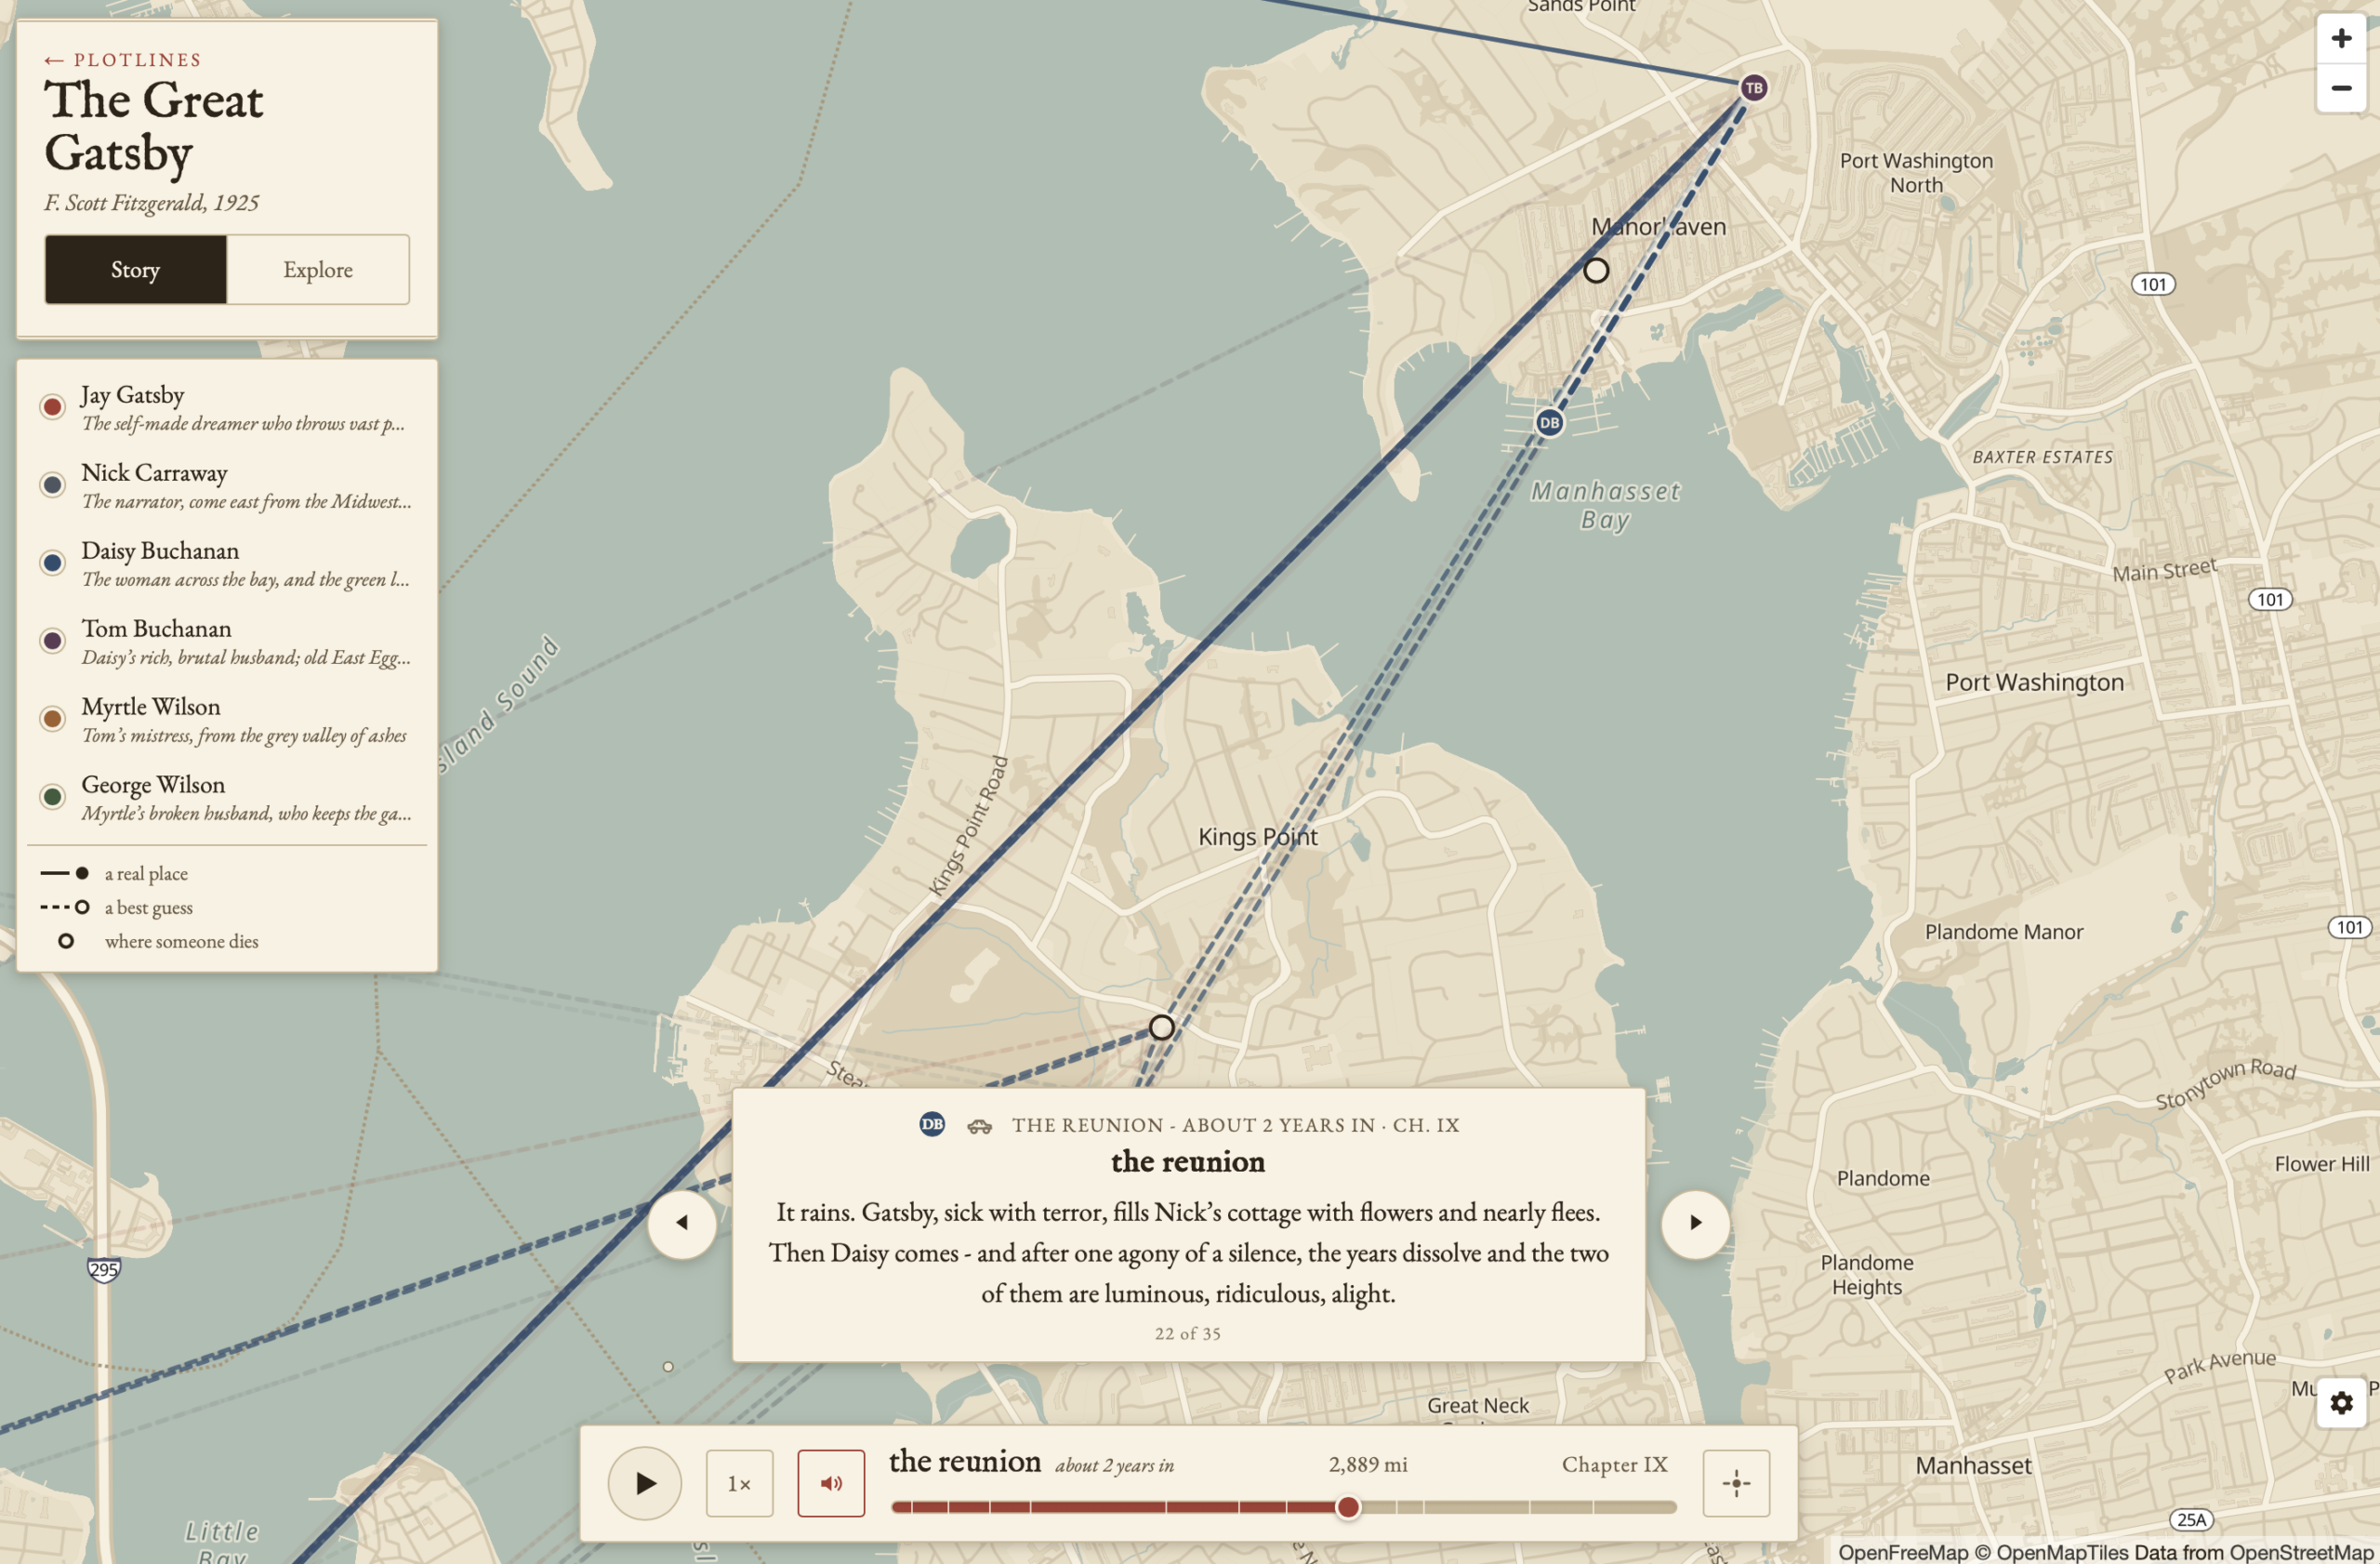
Classic literature journeys mapped
While we’re on the subject of mapping fiction, PlotLines by Chris Moran is a project that maps journeys from out-of-copyright classic literature. A narrative format, with the help of AI for p…
flowingdata.com






George Lucas on the horse and buggy
For A Rabbit’s Foot, Andy Hazel interviewed Star Wars creator George Lucas, mostly about the Lucas Museum of Narrative Art. But towards the end, there is a question of generative AI in movies…
flowingdata.com


Map of underground fungi network
Researchers are studying an underground, global network of fungi that acts as a circulatory system, transporting carbon, water, and nutrients between plants and soils. SPUN, in collaboration with M…
flowingdata.com


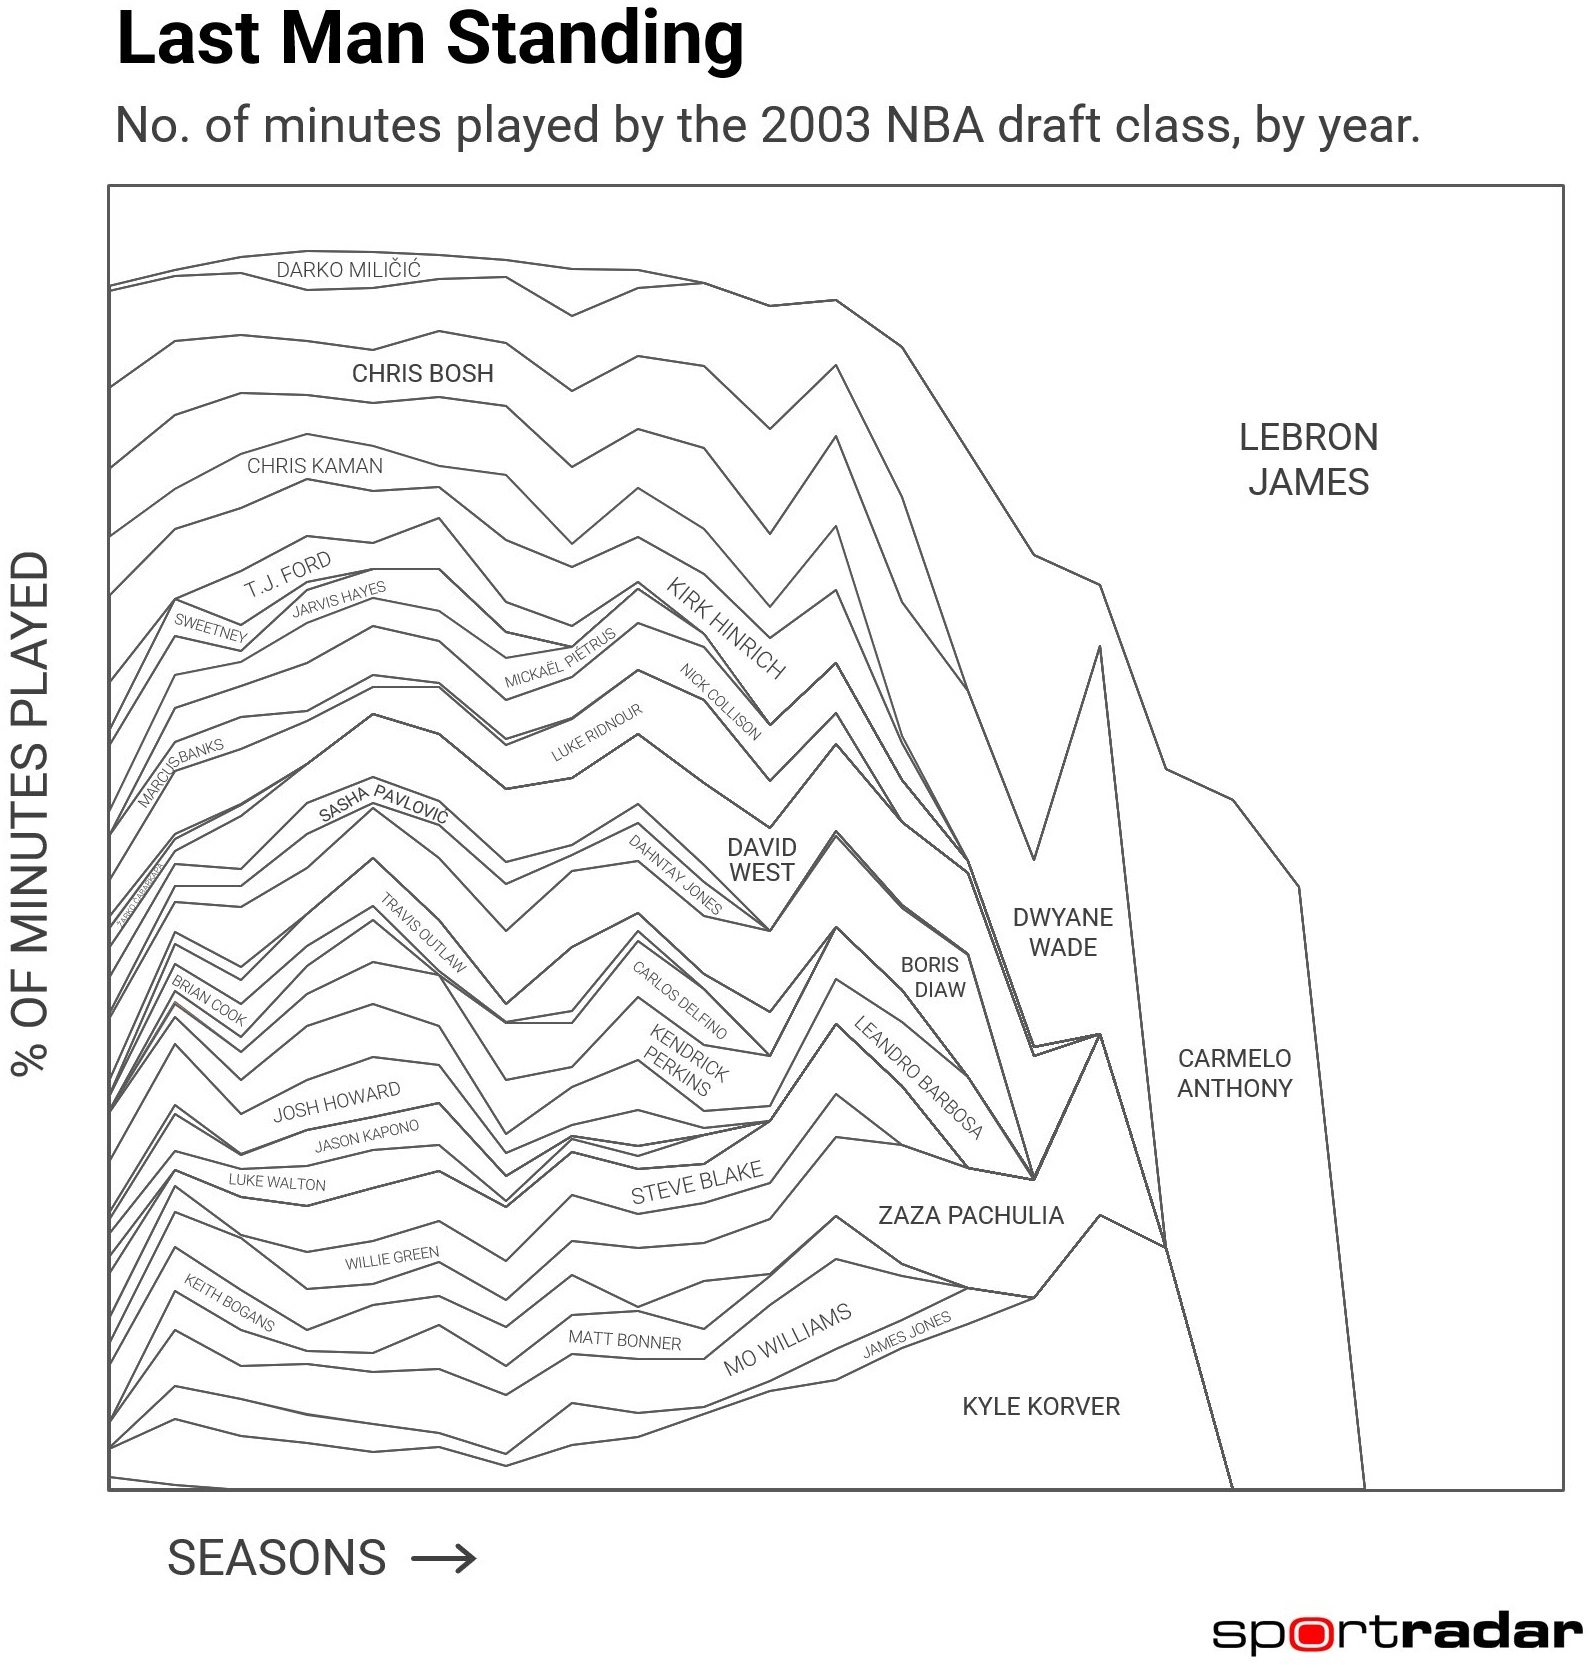
LeBron James longevity in minutes played
Fun stacked area chart by Todd Whitehead for Sportradar, showing the share of minutes among the 2003 NBA draft class. Old man James stands alone: That was some draft class.
flowingdata.com


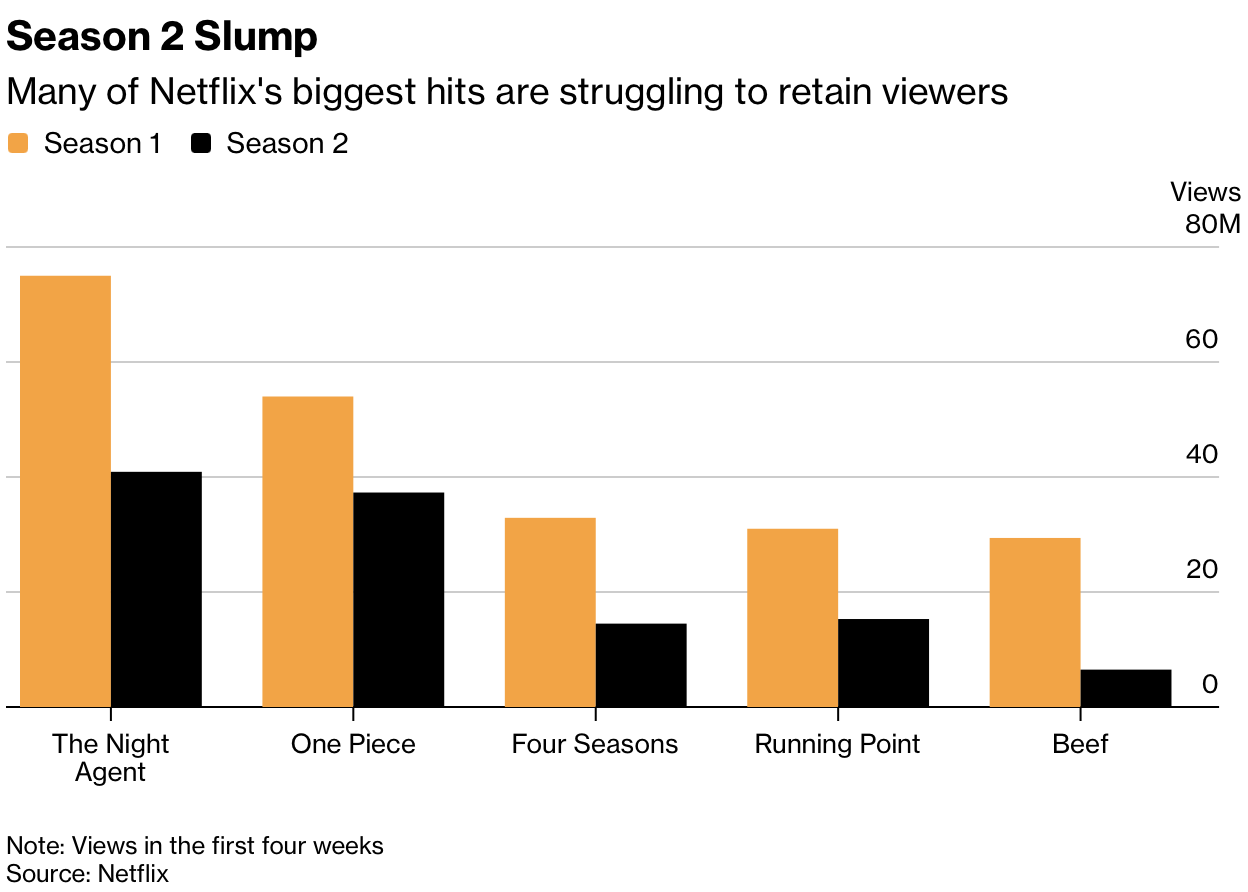
Netflix second-season slump
Netflix shows tend to draw a lot of viewers in the first season and experience a drop-off in the second. Lucas Shaw reporting for Bloomberg: Yet the sharp drop in viewers is a major source of conce…
flowingdata.com
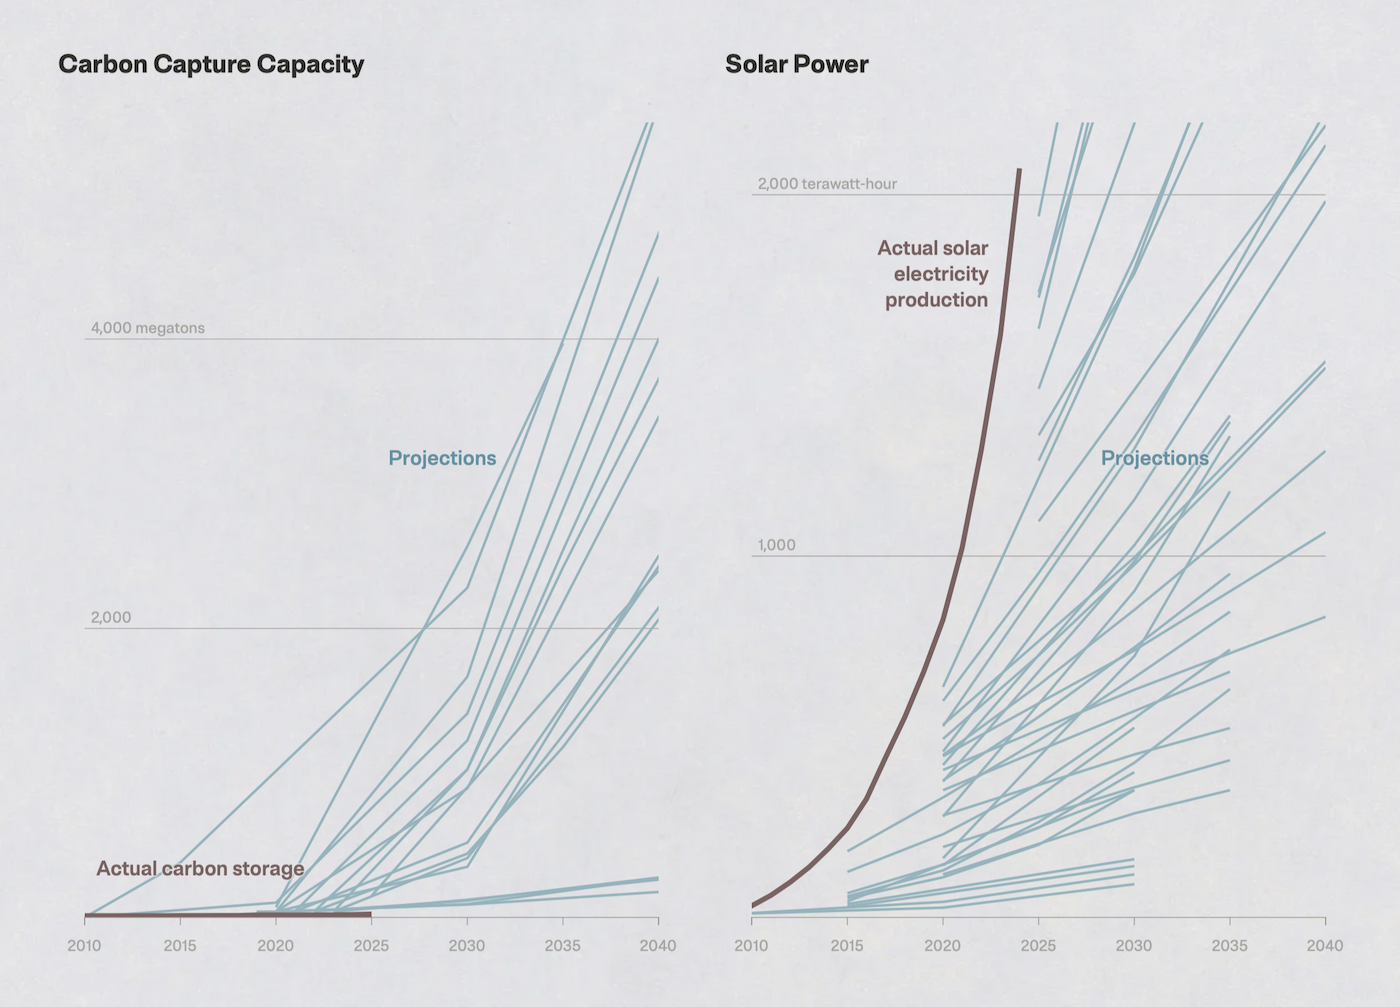
Near impossibility of storing carbon dioxide pollution underground
Oil companies have funded research for decades to figure out how to store carbon dioxide pollution underground. The goal is to let people continue using traditional fuel, or at least that’s t…
flowingdata.com