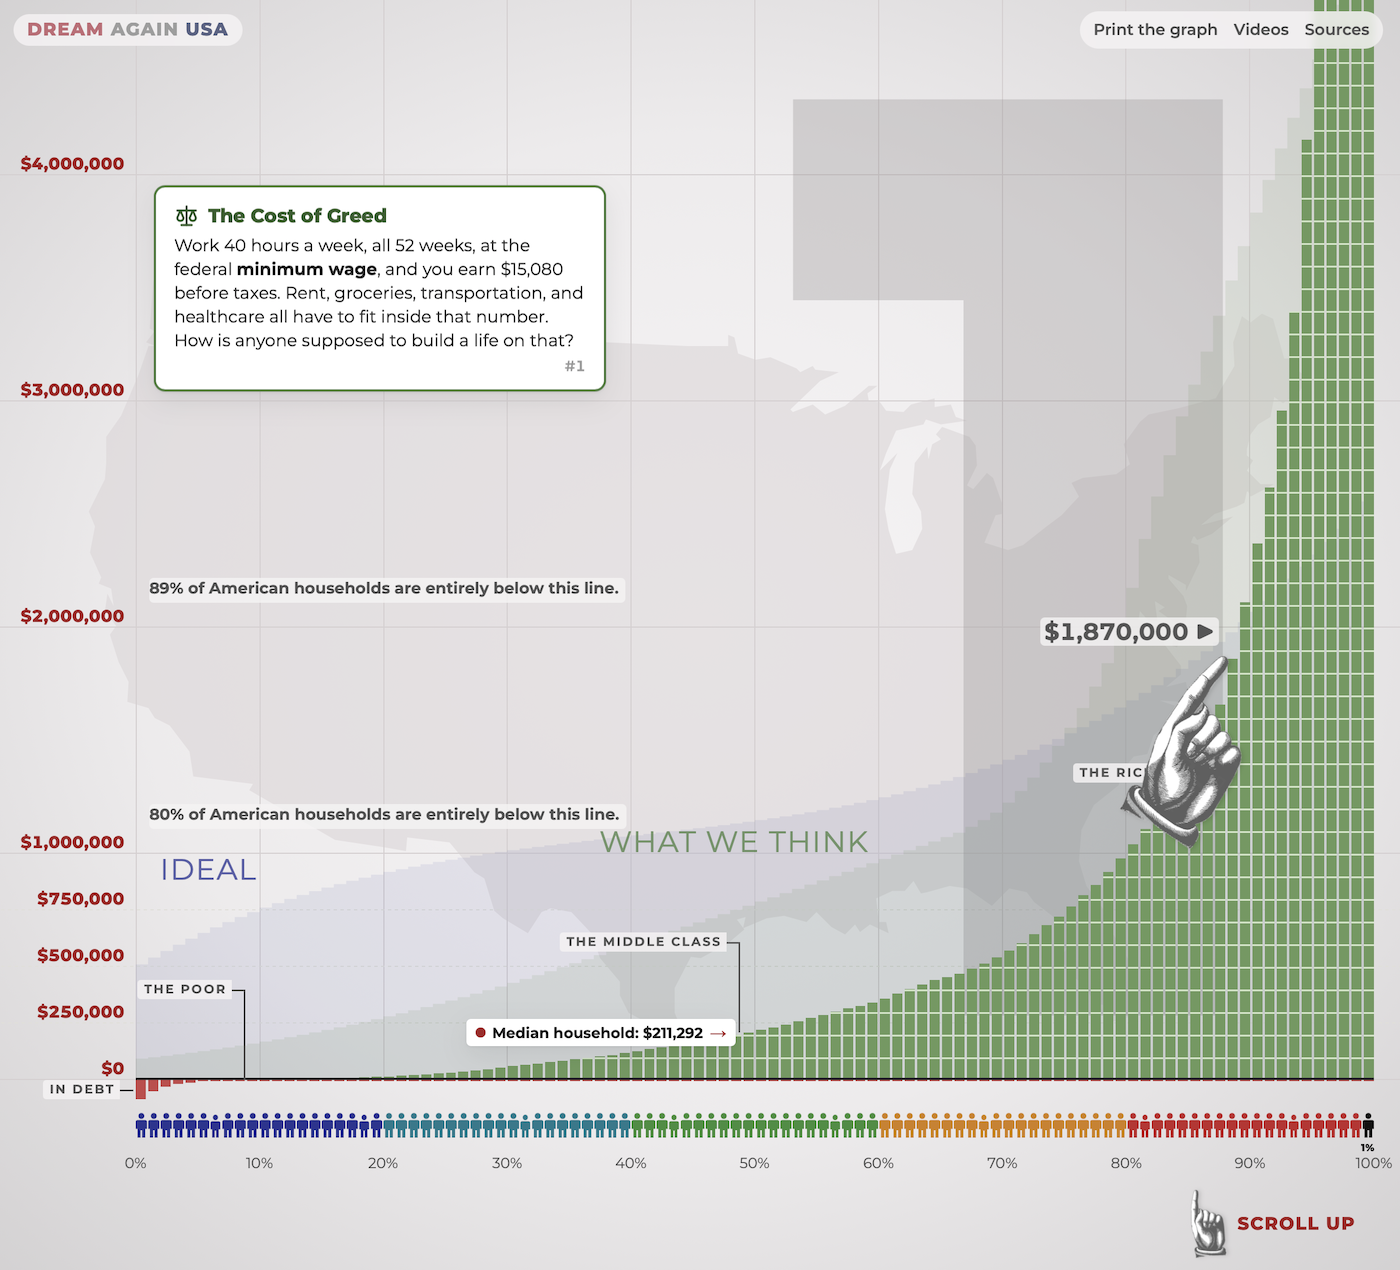
Cost of greed, as unbearably tall chart
Last month, the Wealth Inequality in America video by Politizane got an update after thirteen years. The gap between the richest and the normals has only grown. This interactive version uses the ve…
flowingdata.com

Pumpkinhead
[Stan Winston • 1988]
film-grab.com

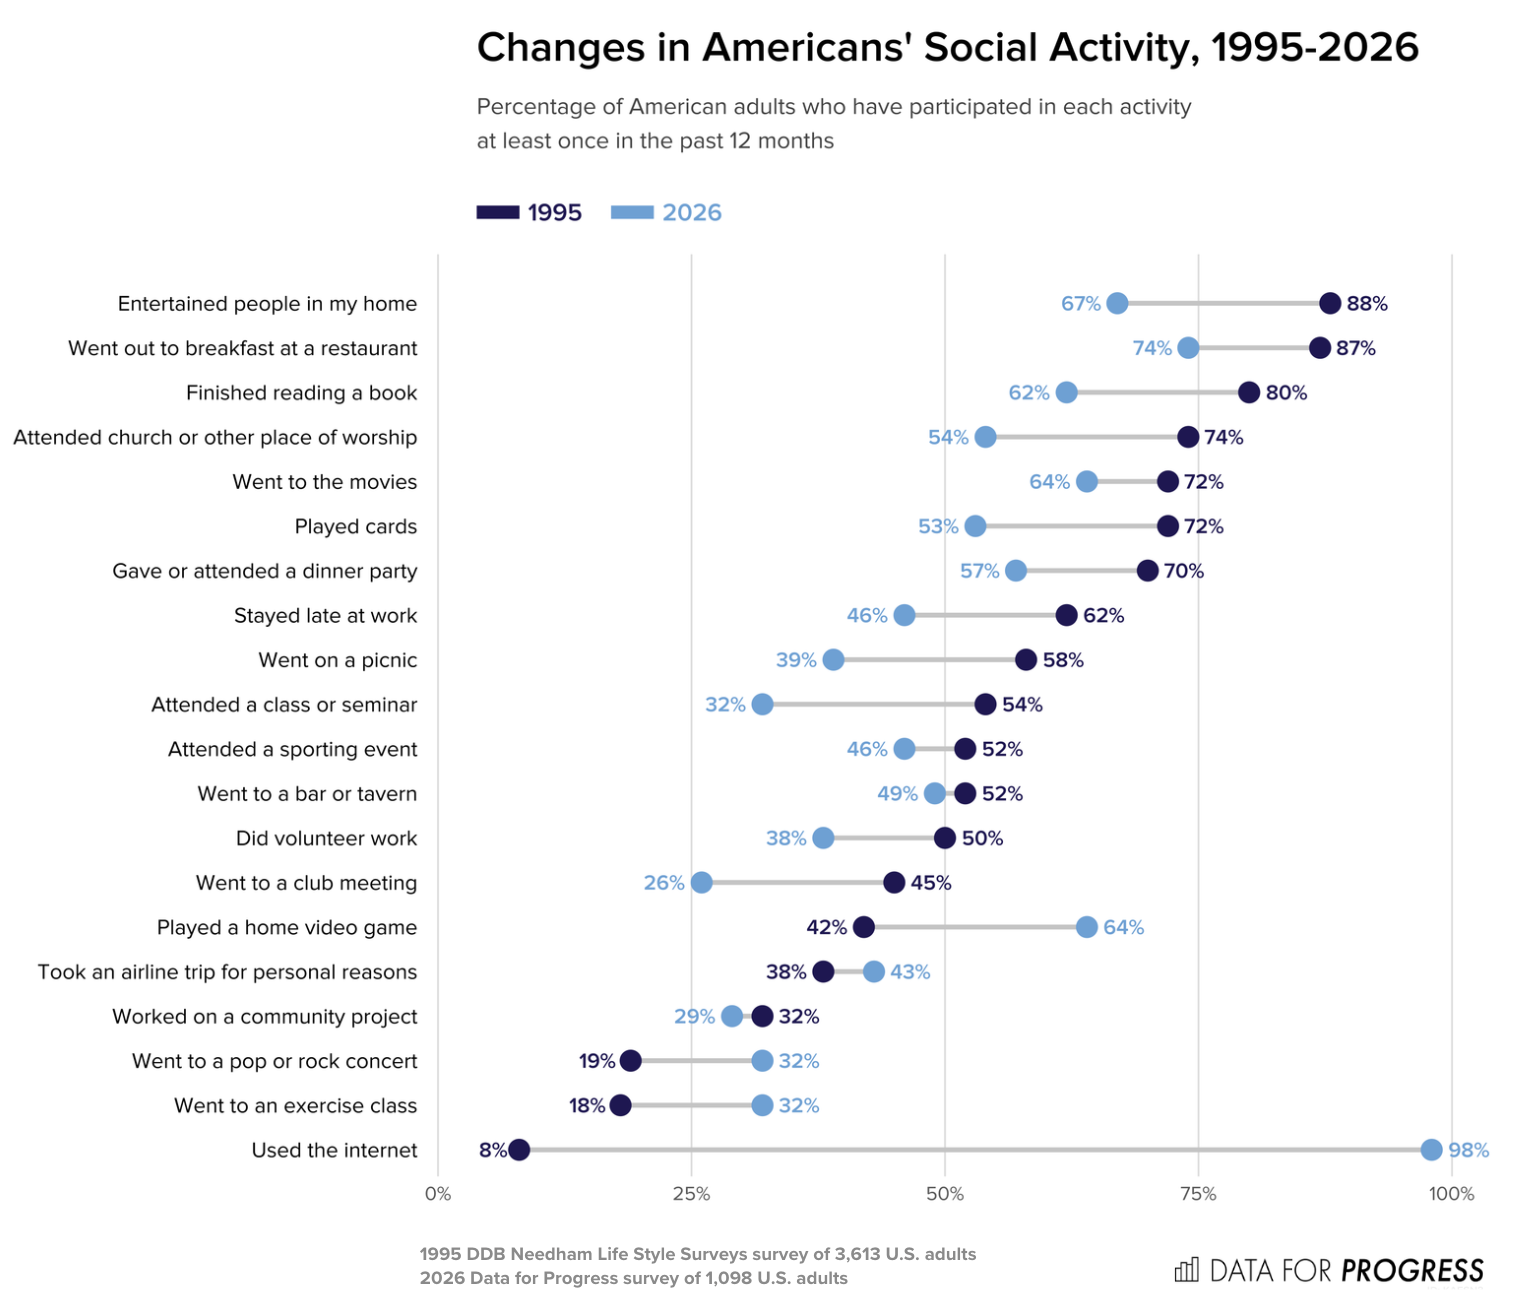
Decline in American social activities
Data for Progress compared social activities among American adults in 1995 against 2026. Hanging out with others is down a lot for many activities. We find that Americans’ participation in various …
flowingdata.com

modu building toys
Some of the best toys begin with very little. MODU is built from a small vocabulary of soft foam blocks, connector pegs and wheels, leaving the rest open to int
minimalissimo.com
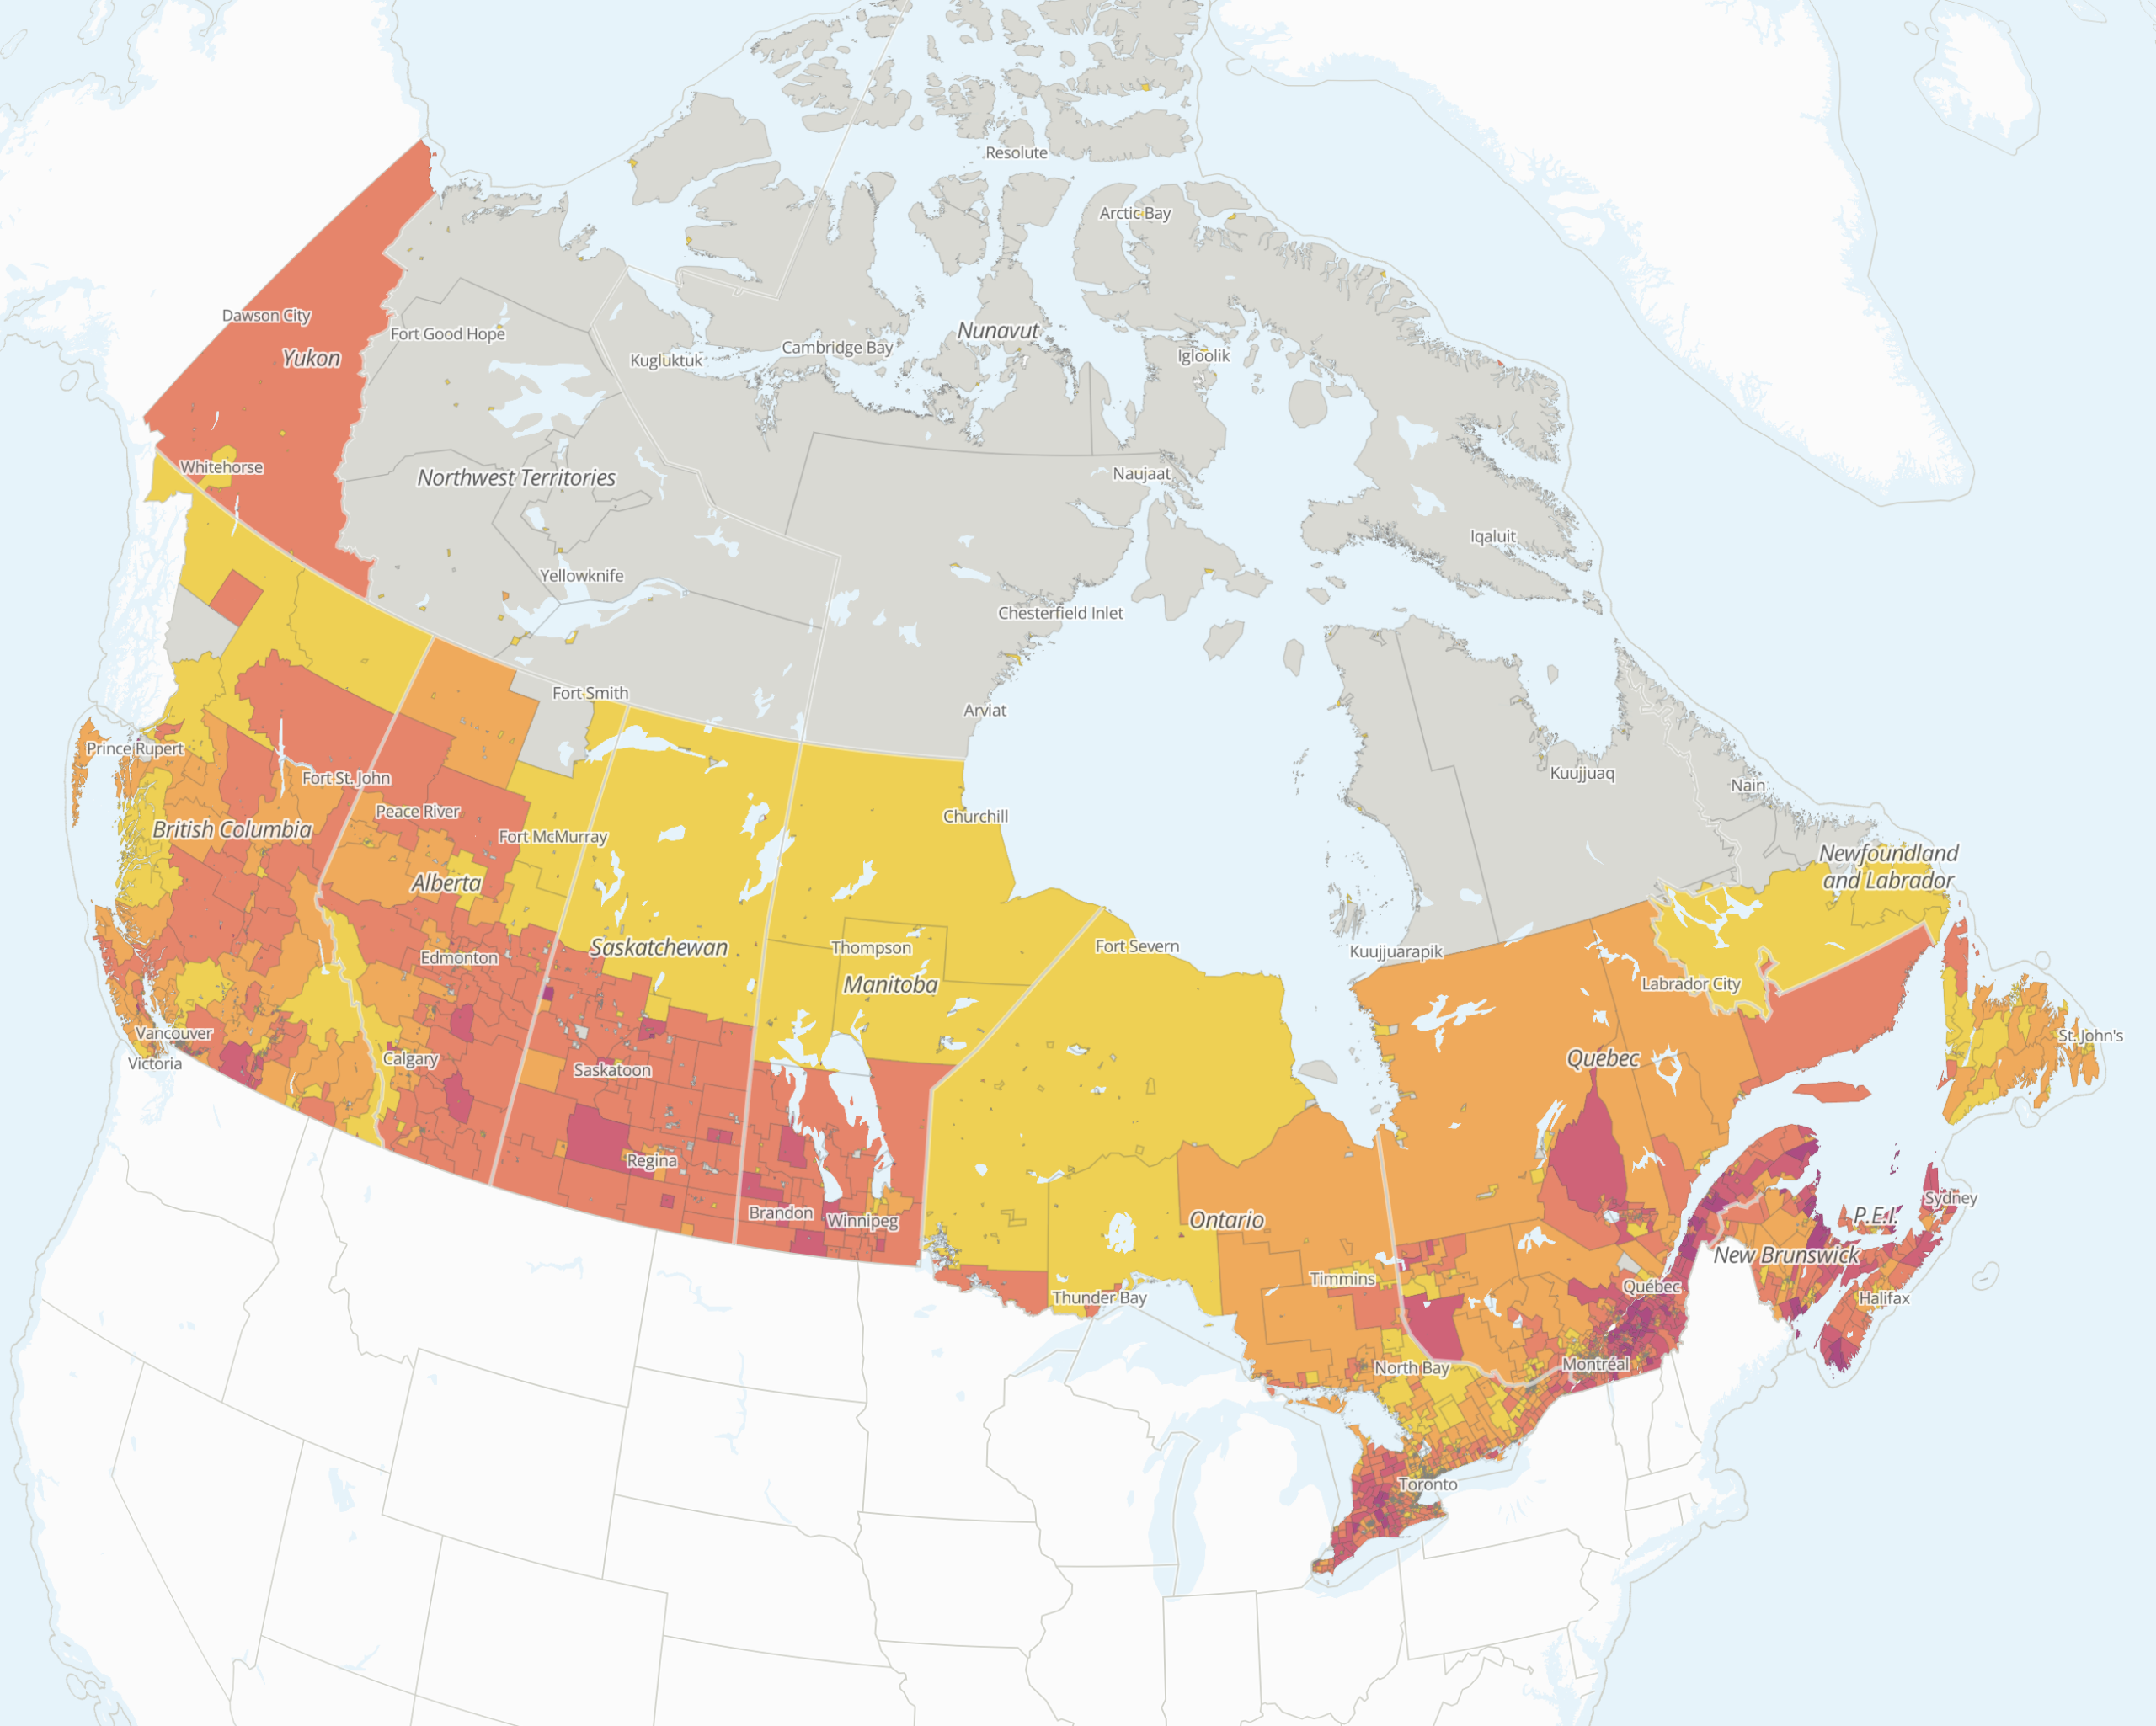
Exposure to tariffs in Canada
Researchers at the School of Cities, a center at the University of Toronto, are studying the impact of U.S. tariffs in Canada. Since May 2025, Tara Vinodrai and Karen Chapple have led a team of res…
flowingdata.com

Extract color palettes from images
OKpalette is a tool to grab a color palette from an image. Load the image in the browser, set the number of colors, and define a region in the image and you get a collection of shades. Images stay …
flowingdata.com
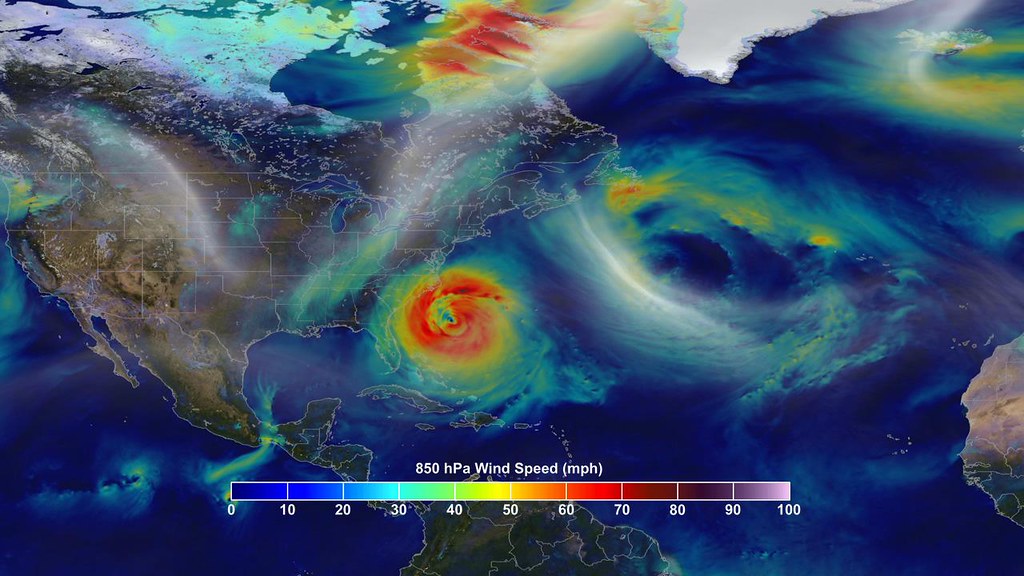

Mathematicians Harness Randomness To Crack a 55-Year-Old Conjecture
After a long hiatus, the problem, which was likely inspired by juggling, has finally been resolved by a group of young mathematicians.
quantamagazine.org
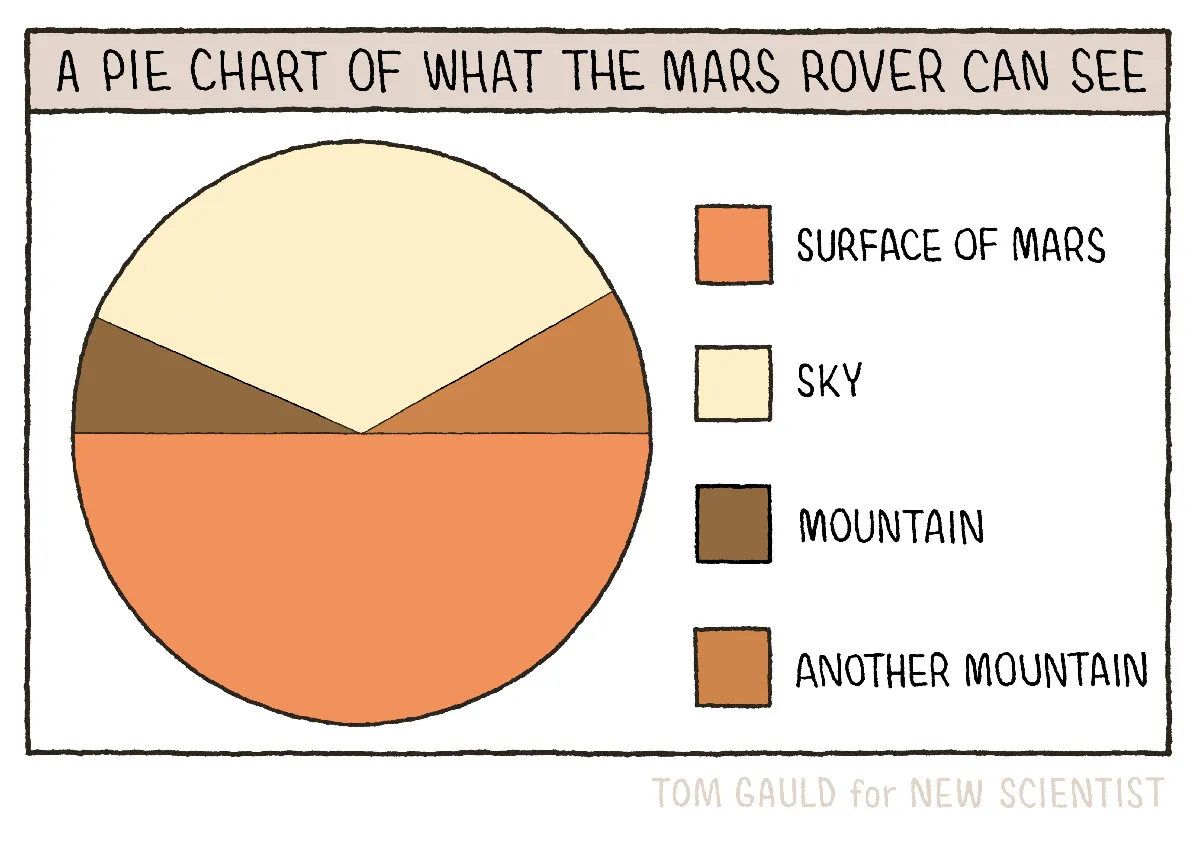
Pie chart of what the Mars rover can see
New to me, Tom Gauld, for New Scientist, made a fine pie chart to show what the Mars rover can see while on the surface of the Red Planet. This is up there with the pie chart pyramid and eaten pie.
flowingdata.com
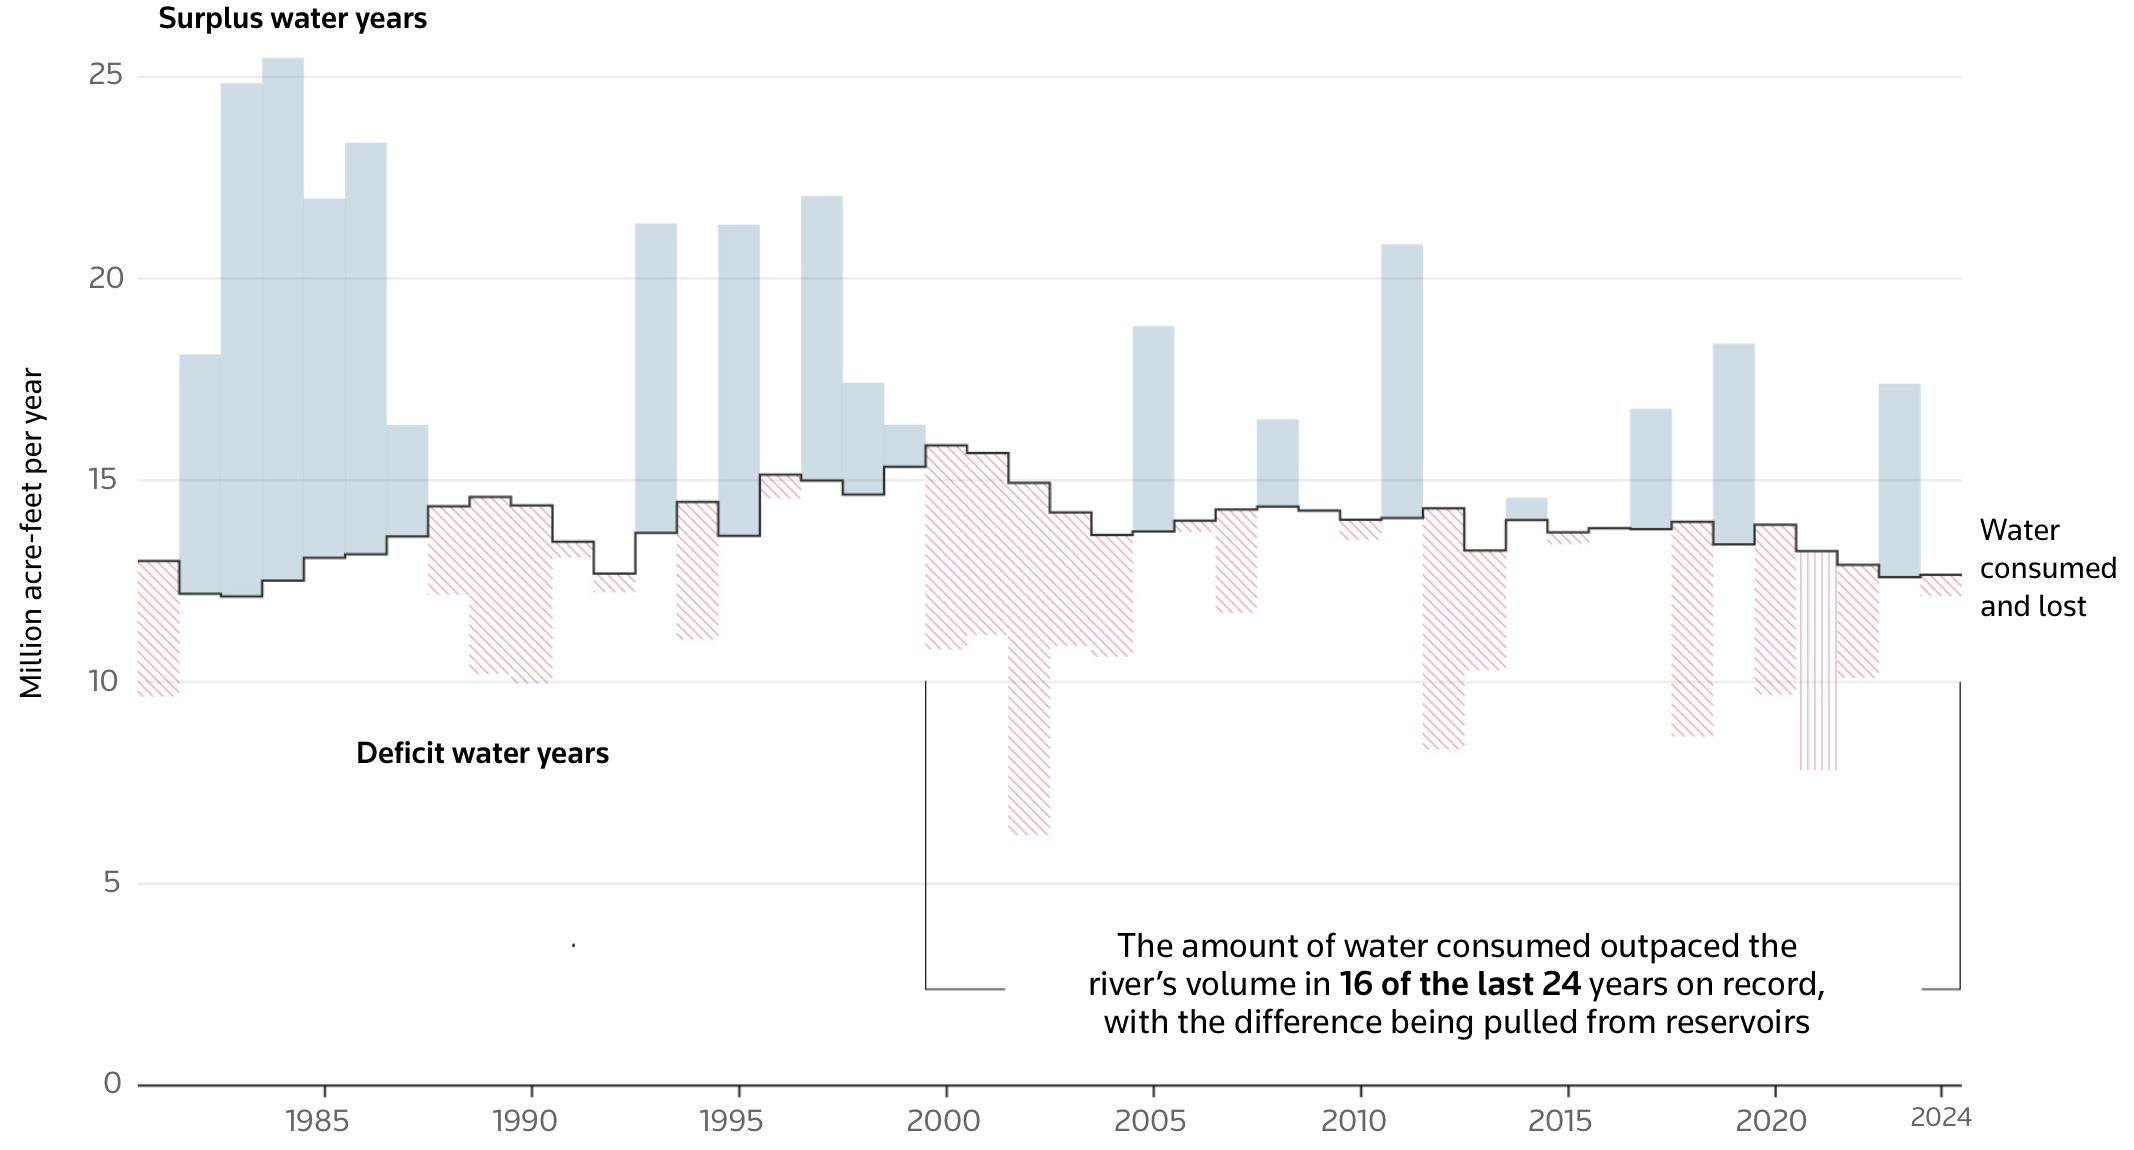
Consuming more than the Colorado River provides
The Colorado River is at risk due to drought and states using more than the river provides. For Reuters, Travis Hartman and Andrew Hay mapped and charted how volumes have changed over time. Water u…
flowingdata.com

Laurentius the Profit Found Heaven in a Cave
The Berlin artist traveled to a cave church in Turkey to record an album where mistakes, echoes, and rough edges are essential to the story.
daily.bandcamp.com

What it’s like when a data center moves in
For the Verge, Lauren Feiner visited Loudoun County, Virginia, which used to be the location of AOL headquarters. After the dot-com bust, the county opened the empty AOL buildings and infrastructur…
flowingdata.com
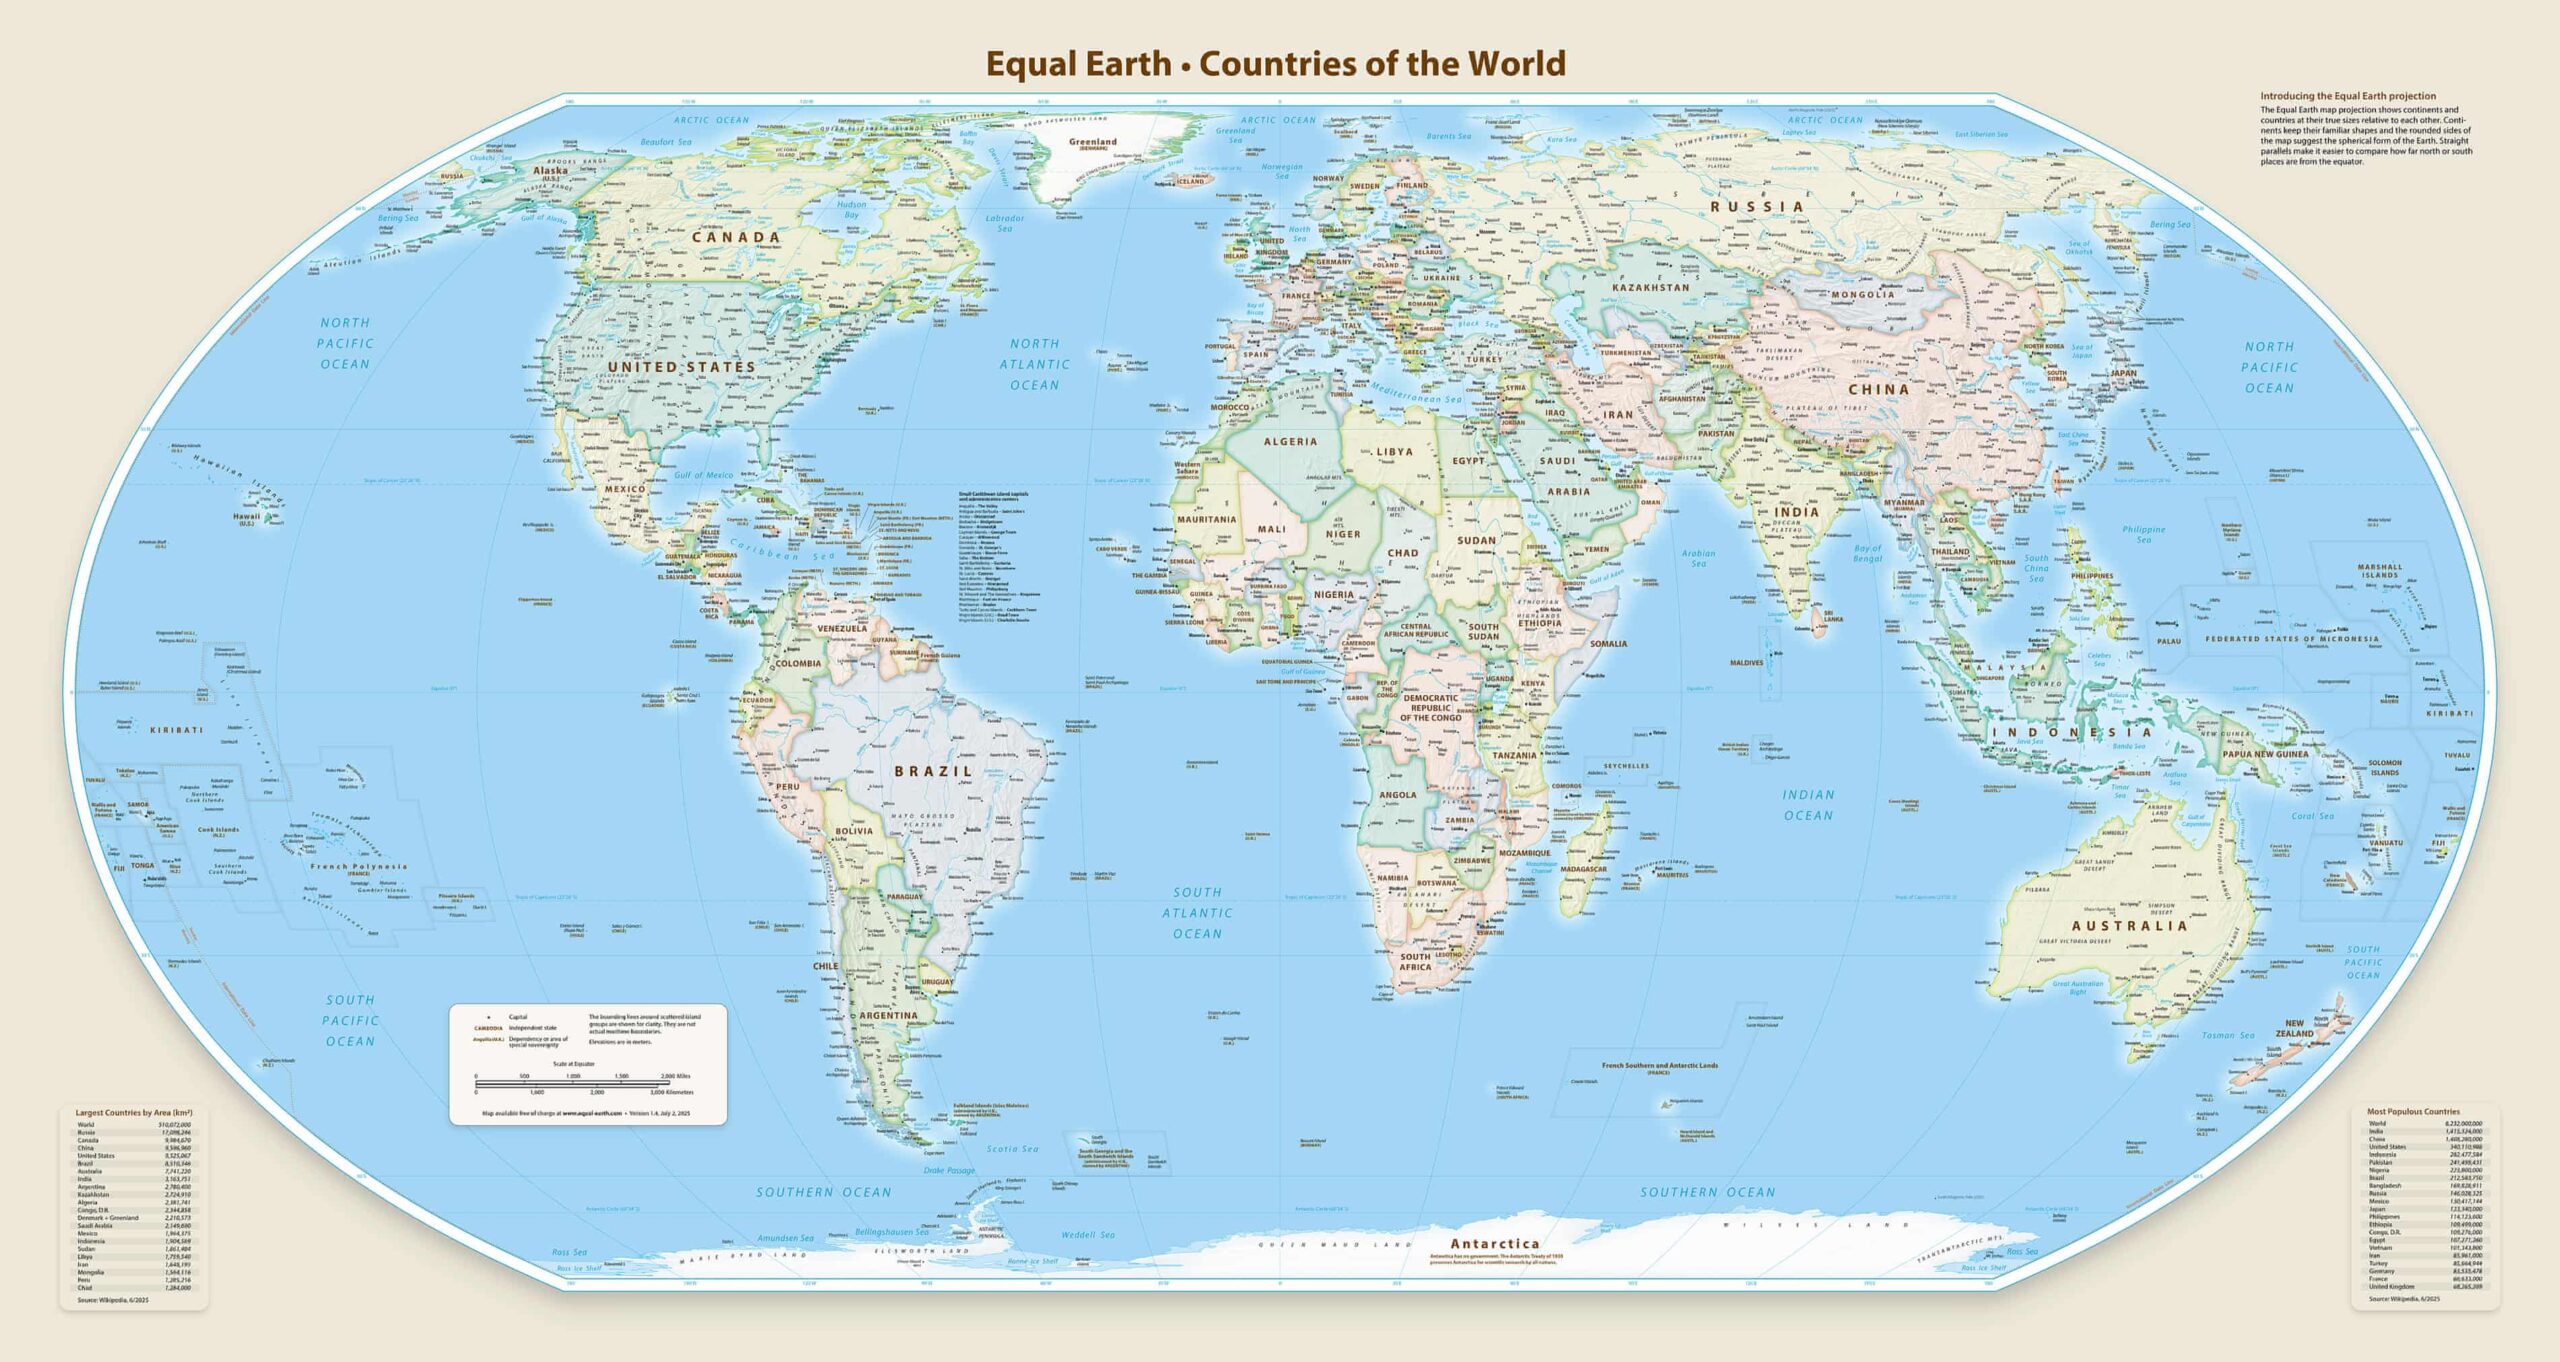
UN votes to support map projection that accurately shows the size of Africa
Last year, the African Union pushed for wider adoption of the Equal Area map projection so that the size of Africa is more accurately shown around the world. A few days ago, the United Nations vote…
flowingdata.com

Retroid Pocket Duo makes dual-screen gaming feel fresh again with its modern clamshell design
https://www.youtube.com/watch?v=9l4WZYU9Cg8 There is something immediately satisfying about a handheld that refuses to make two screens behave like one. Retroid’s new Pocket Duo takes that idea and builds it into a modern clamshell, giving Nintendo DS and 3DS-style gaming a form factor that feels considerably more natural than squeezing both displays onto a single screen. The
yankodesign.com
✚ Application of charts and data
This week is about adapting our visualization workflow as the tools change dramatically.
flowingdata.com
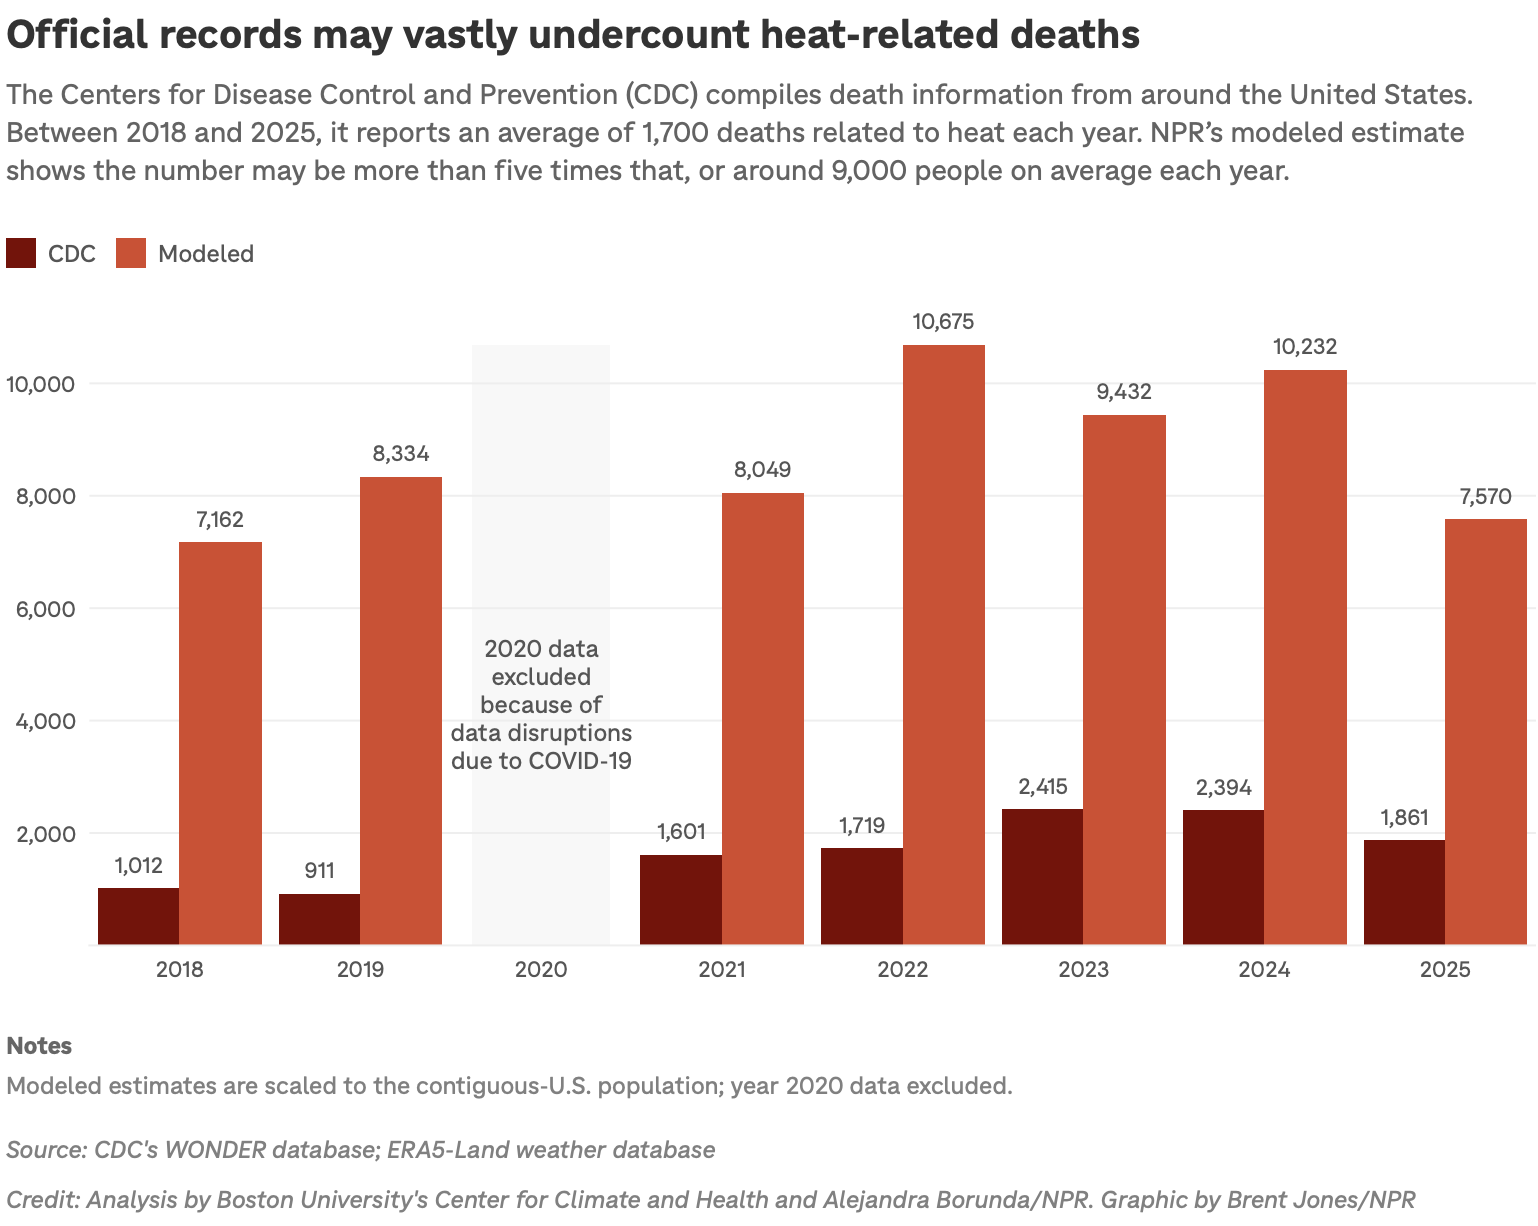
Uncounted heat-related deaths
The U.S Centers for Disease Control and Prevention count causes of death, and heat is included in the tabulations. However, it is likely that the reports for heat are undercounts. NPR, in collabora…
flowingdata.com
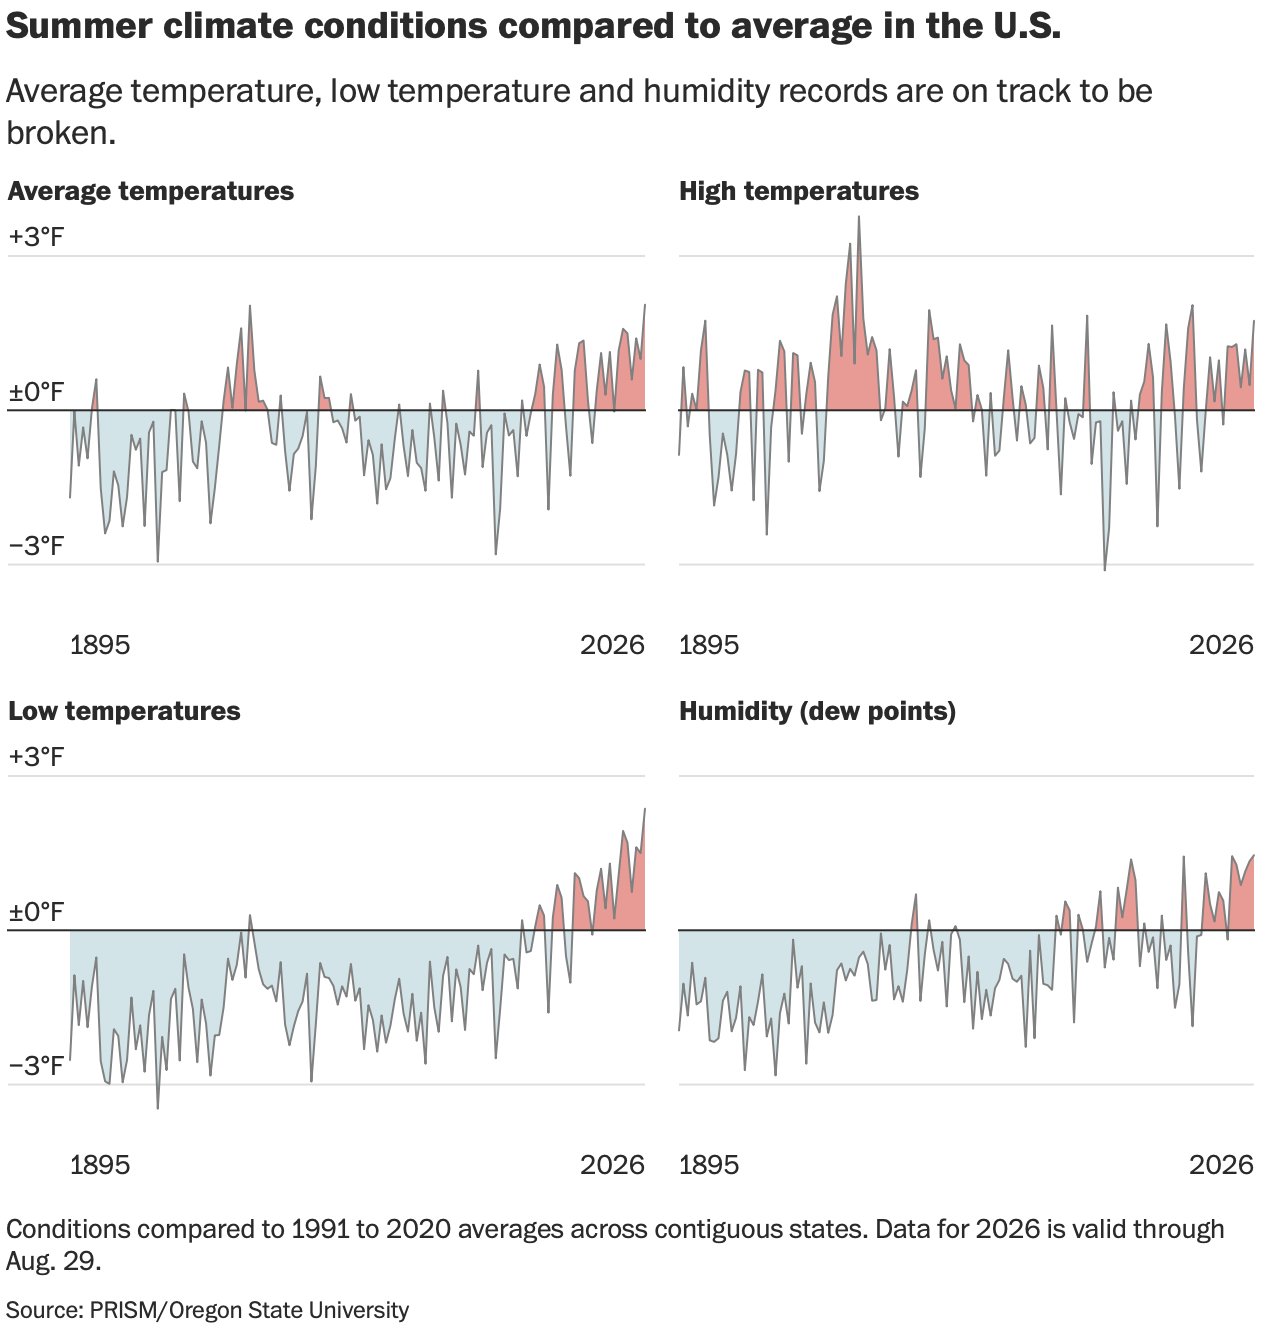
Cooling down less in the evening
The summer of 2026 will most likely be the hottest summer on record since 1936. Part of that is hot days, but more significantly it’s cooling down less at night, which raises the overall aver…
flowingdata.com

Trustworthy data visualization
Kieran Healy, a professor of sociology at Duke University, gives an enjoyable lecture on the limits of trust in data visualization. We were already approaching a place where people could say what t…
flowingdata.com


Google buys Spirit Airlines data in bankruptcy sale
Spirit Airlines went bankrupt for real this time, and Google bought the data. AJ Dellinger reports for Gizmodo: Google’s winning bid in the auction was priced at $10 million, outbidding Mercor, an …
flowingdata.com


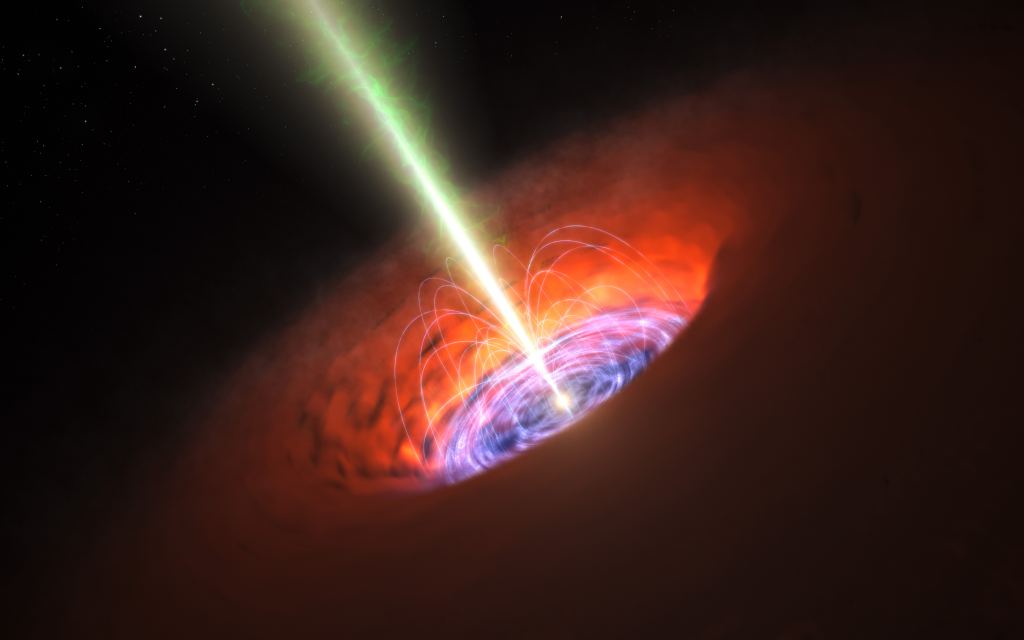
Massive Exoplanets Could Form Around Supermassive Black Holes
Black holes aren't just engines of inexorable destruction. They're complex regions of space and time, and under the right conditions, giant planets can form in their AGN disks.
universetoday.com
website inspiration: simeon sh
onepagelove.com
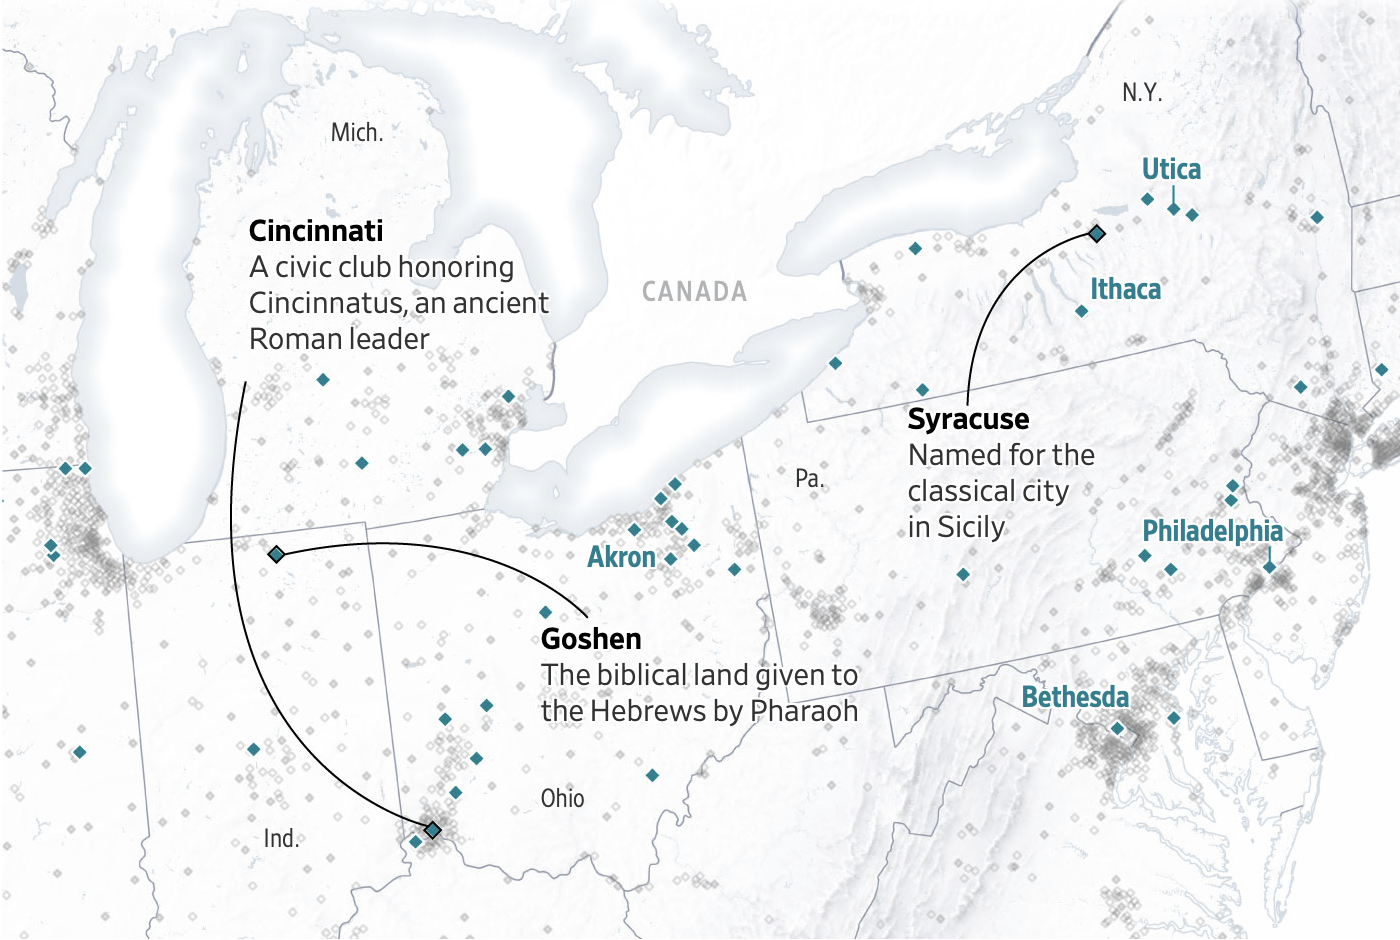
Origins of American city names
In the early 1900s, Henry Gannett cataloged the origins of city names in the United States. For the Wall Street Journal, Carl Churchill made a searchable map to see where your city’s name cam…
flowingdata.com


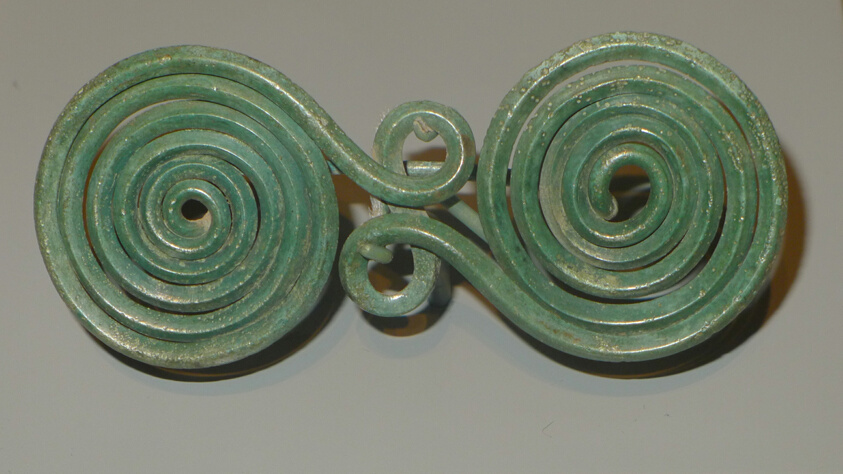
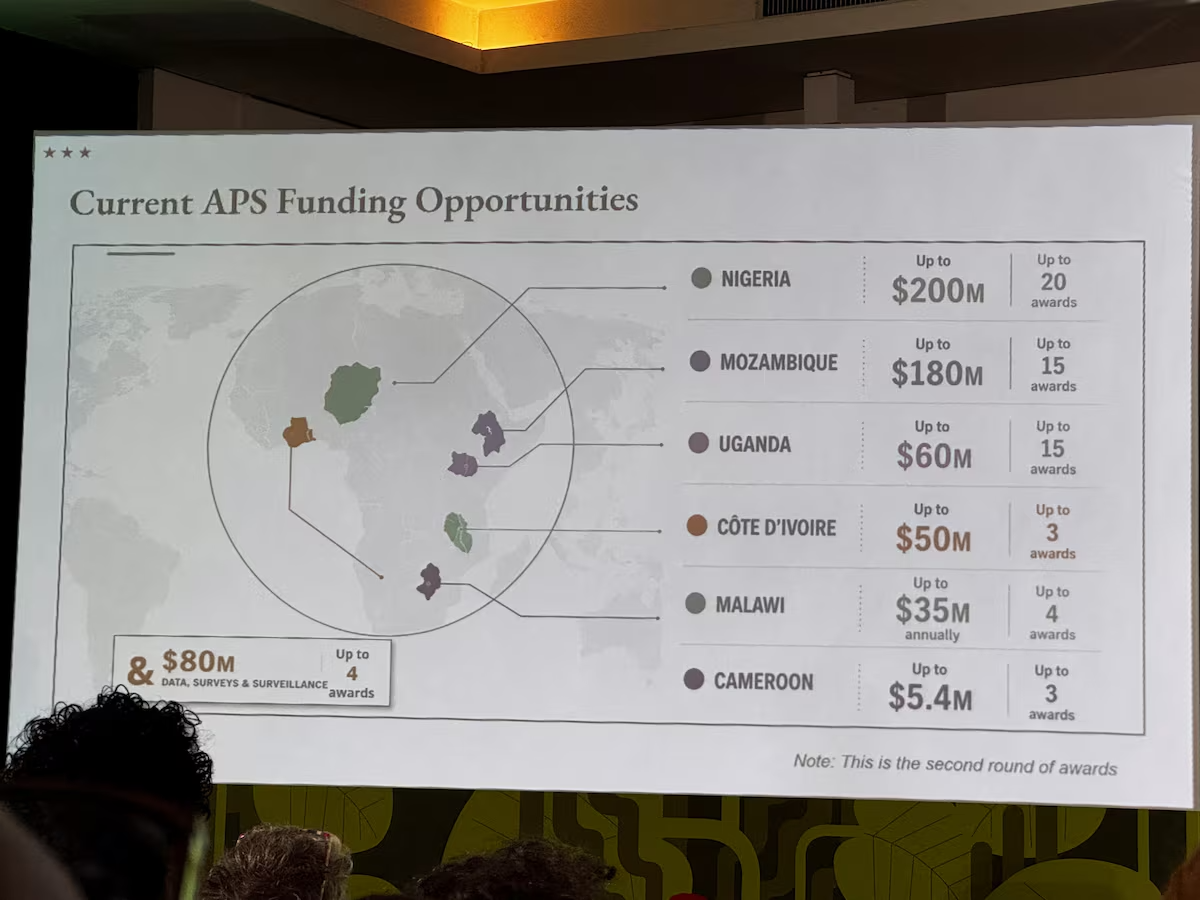
Botched map of Africa in U.S. government presentation
In a presentation by the State Department, a generated map provides all the highlighted countries mislabeled. Jessica Donati reports for Reuters: The State Department said it took “full resp…
flowingdata.com





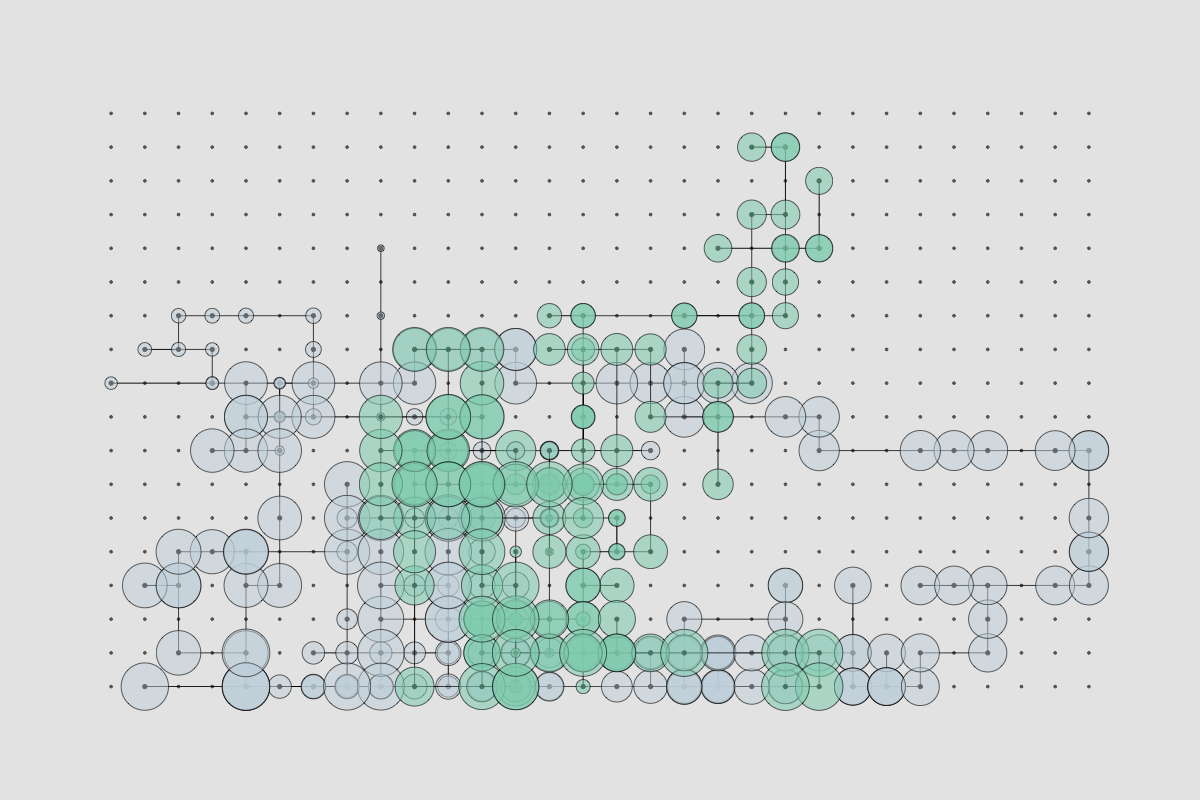
✚ Visualization tools, datasets, and resources — July 2026 roundup
Here is what happened in July.
flowingdata.com

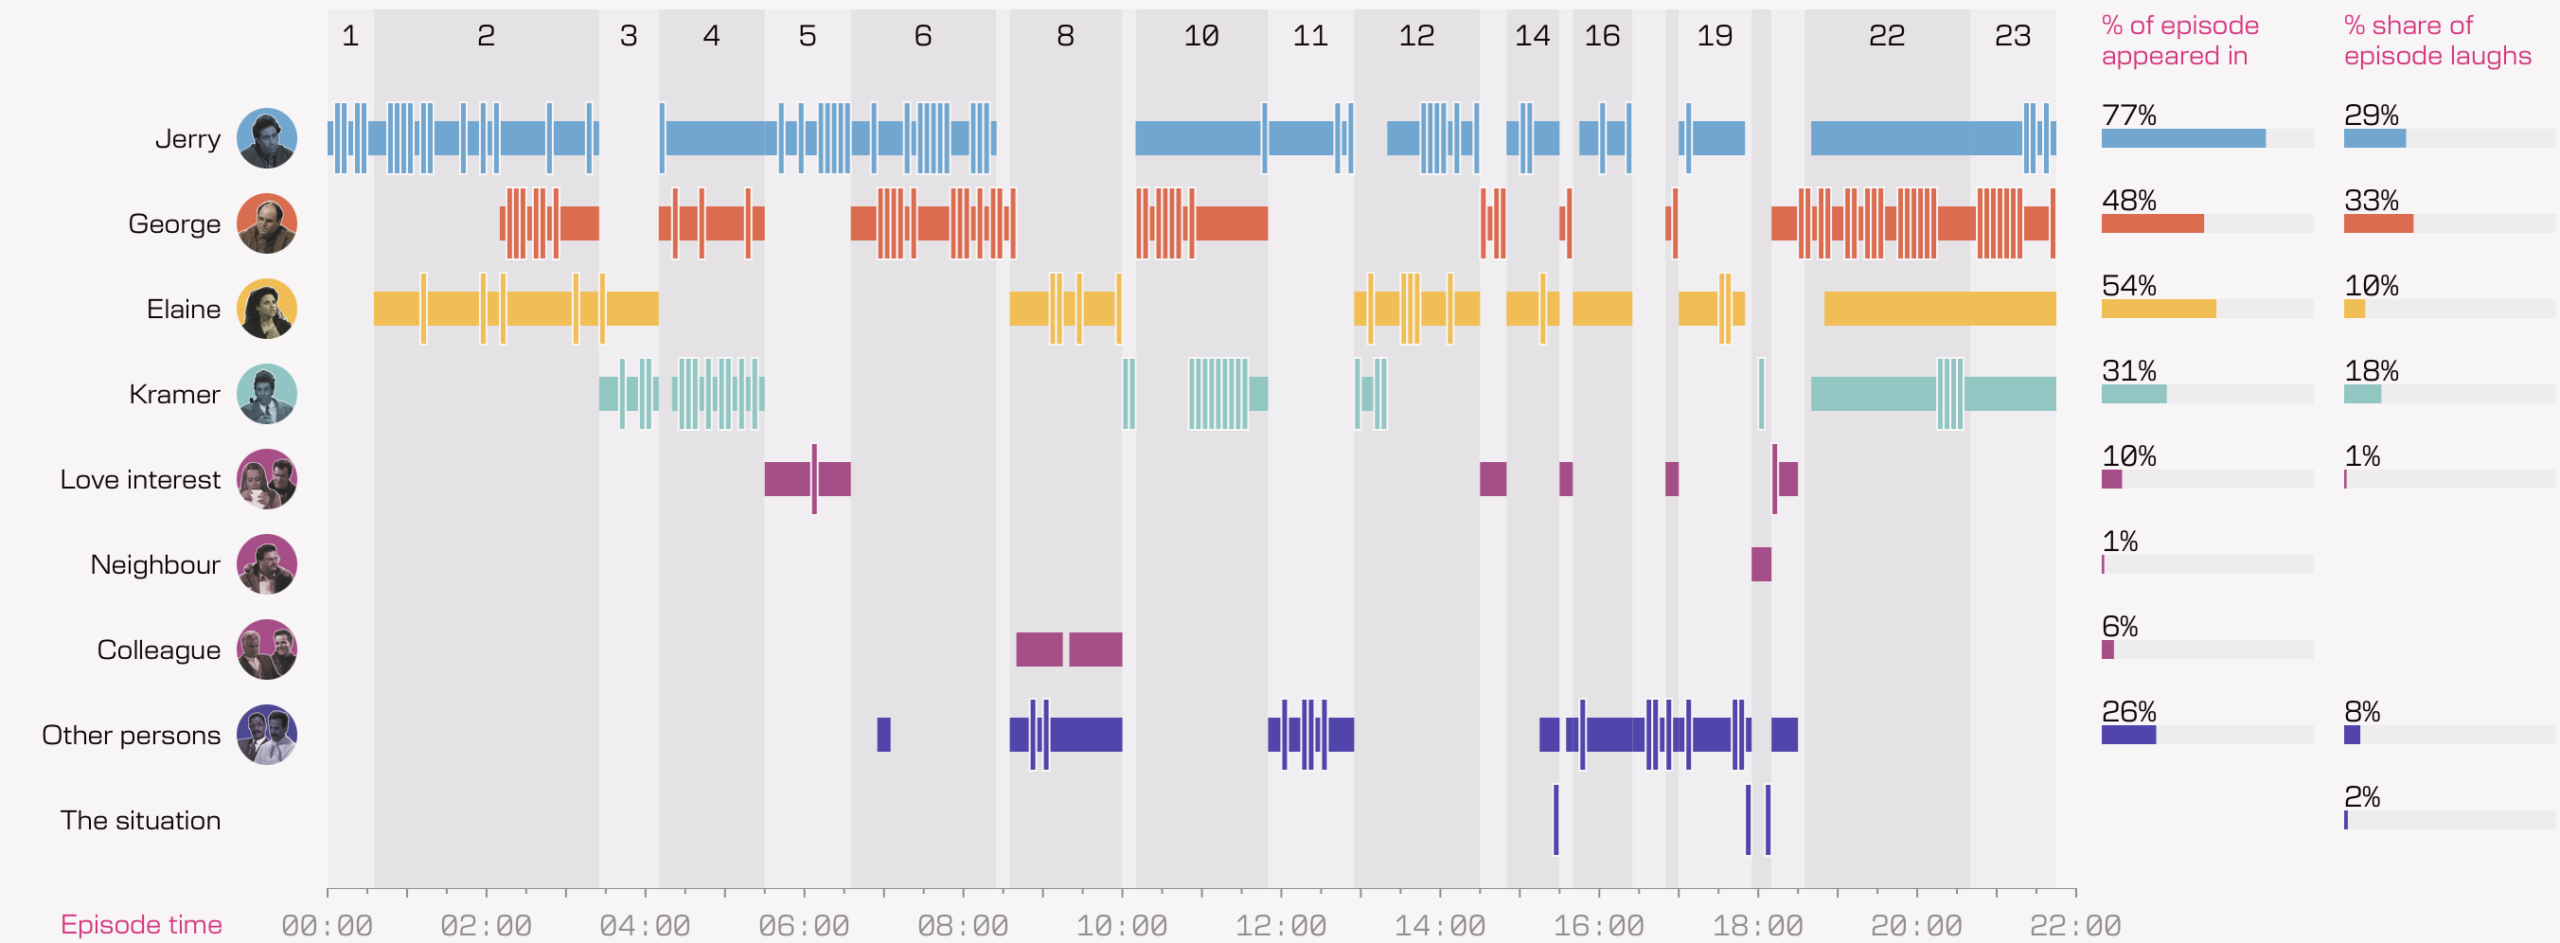
Seinfeld episodes and characters, a visual exploration
Several years ago, Andy Kirk watched every episode of the sitcom Seinfeld, all the while collecting data in five-second increments. He visualized the data in book-form, but now there’s a fun …
flowingdata.com




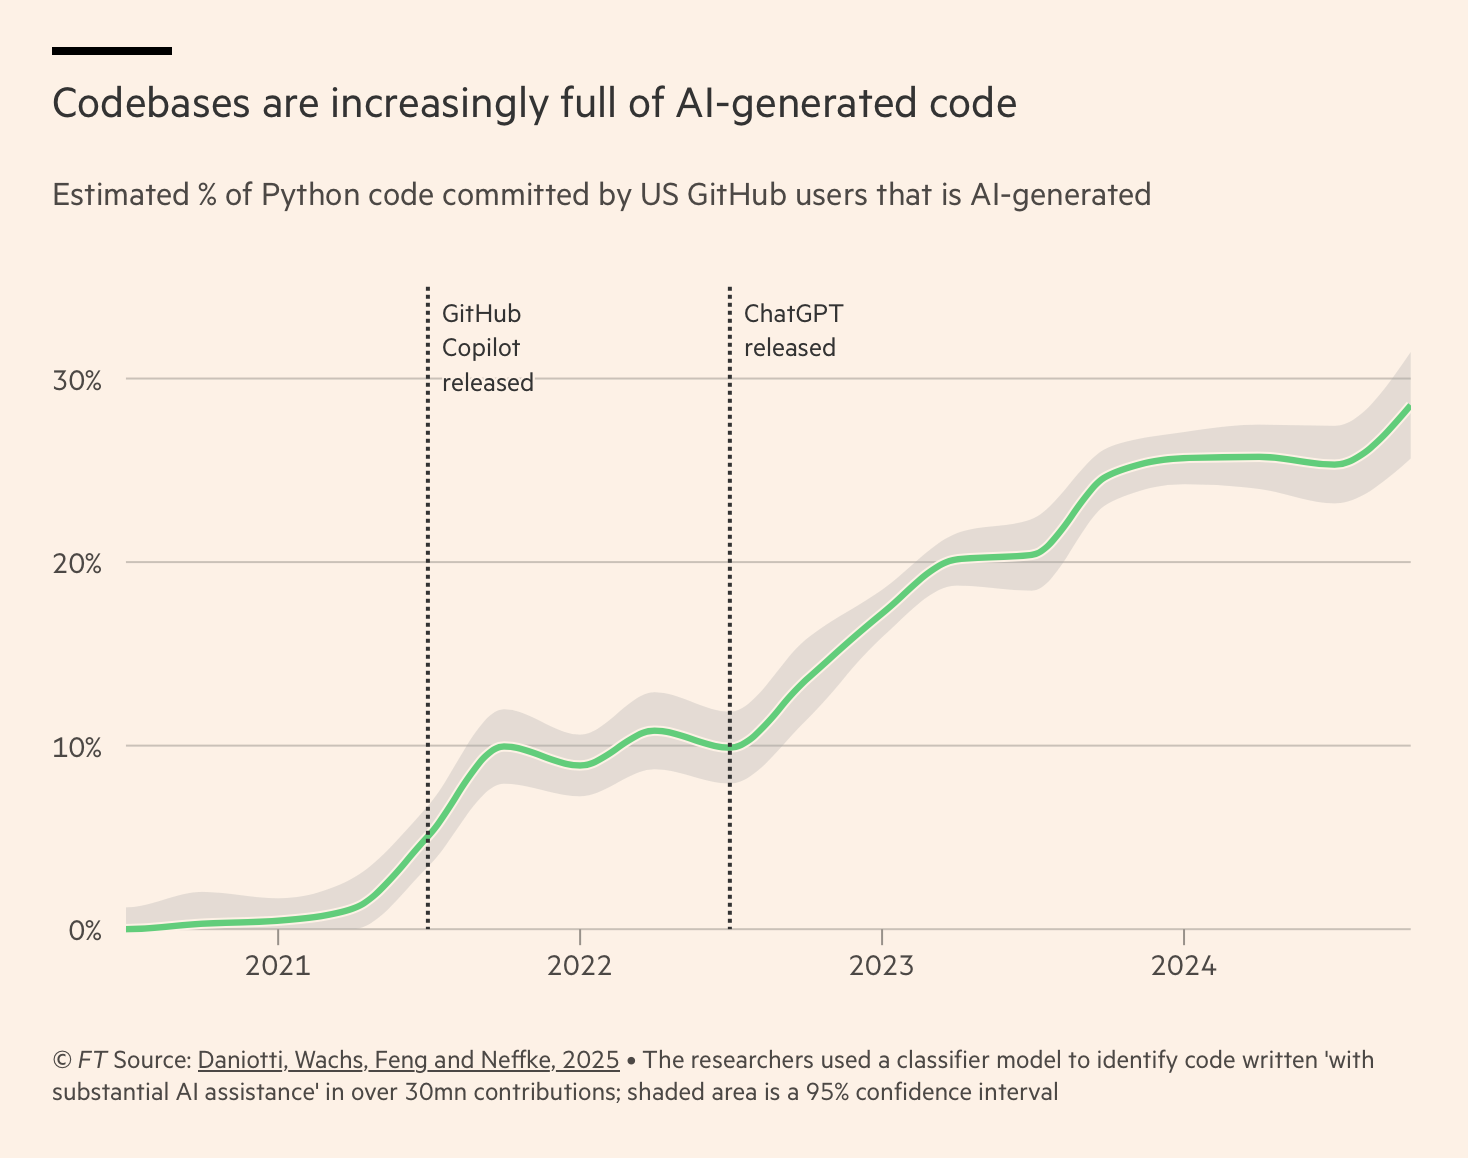
Maintaining a vibe-coded internet
The internet runs on a foundation of open-source software, but codebases, the learning process, and project maintenance grows more muddled as it gets easier to produce code without knowing what any…
flowingdata.com

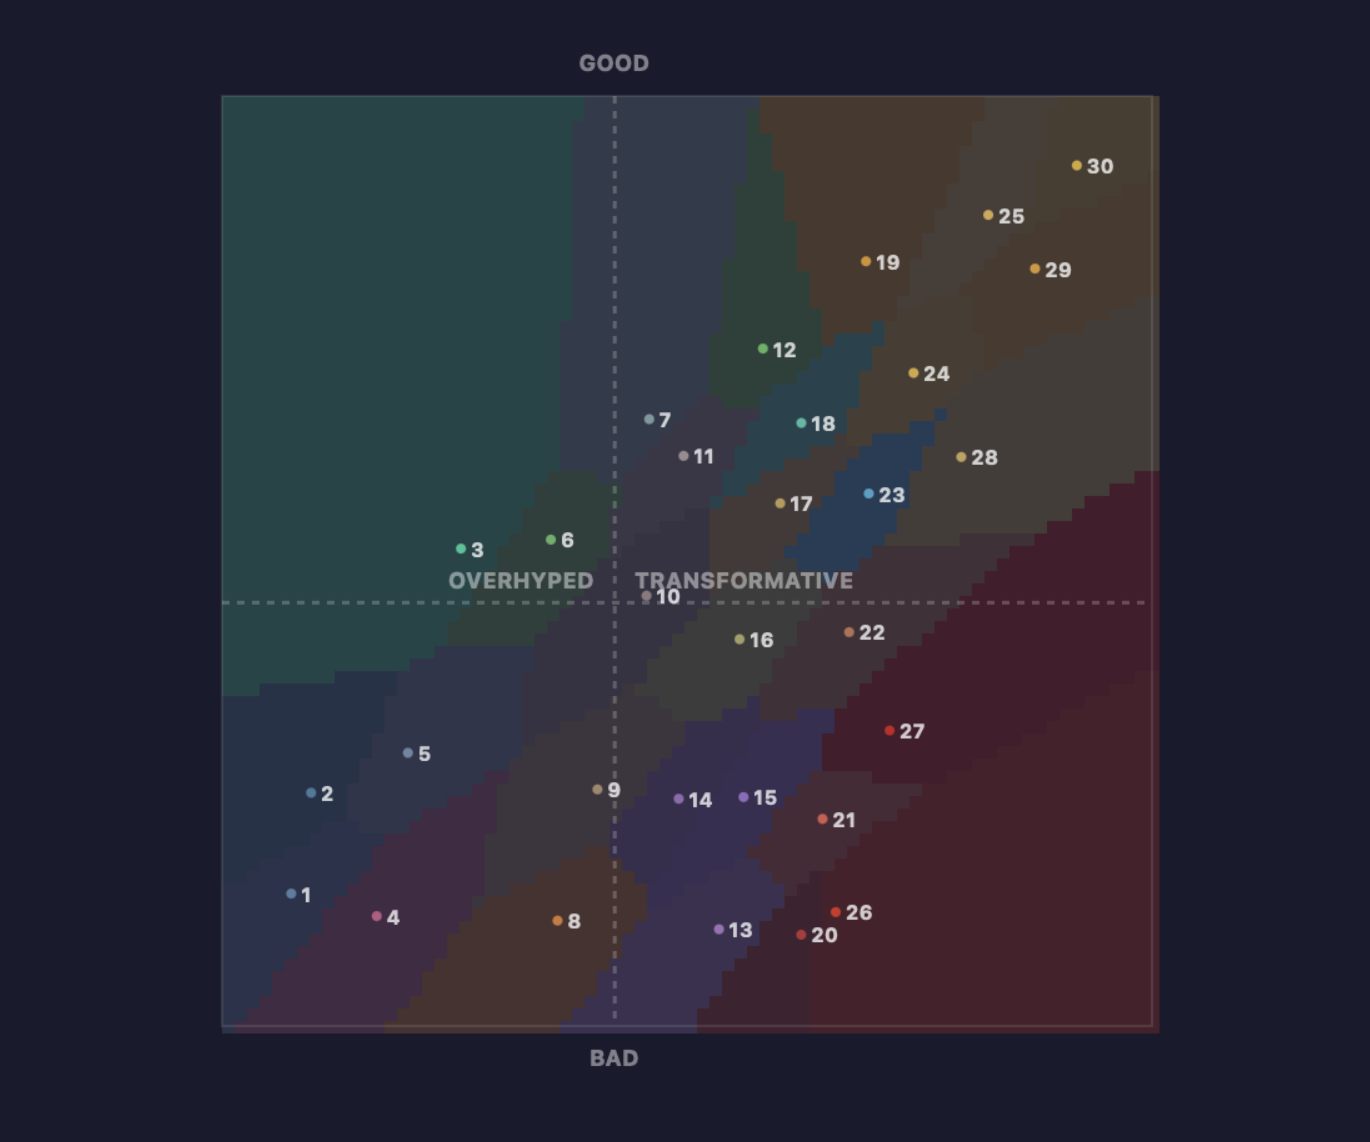
Map of AI archetypes
AI Compass is a quiz of thirty questions that asks for your opinion on various topics. At the end, you are given an archetype that sits somewhere in an x-y-space with overhyped to transformative on…
flowingdata.com